Danish vs Iroquois Seniors Poverty Over the Age of 65
COMPARE
Danish
Iroquois
Seniors Poverty Over the Age of 65
Seniors Poverty Over the Age of 65 Comparison
Danes
Iroquois
8.8%
SENIORS POVERTY OVER THE AGE OF 65
100.0/ 100
METRIC RATING
6th/ 347
METRIC RANK
11.9%
SENIORS POVERTY OVER THE AGE OF 65
1.7/ 100
METRIC RATING
234th/ 347
METRIC RANK
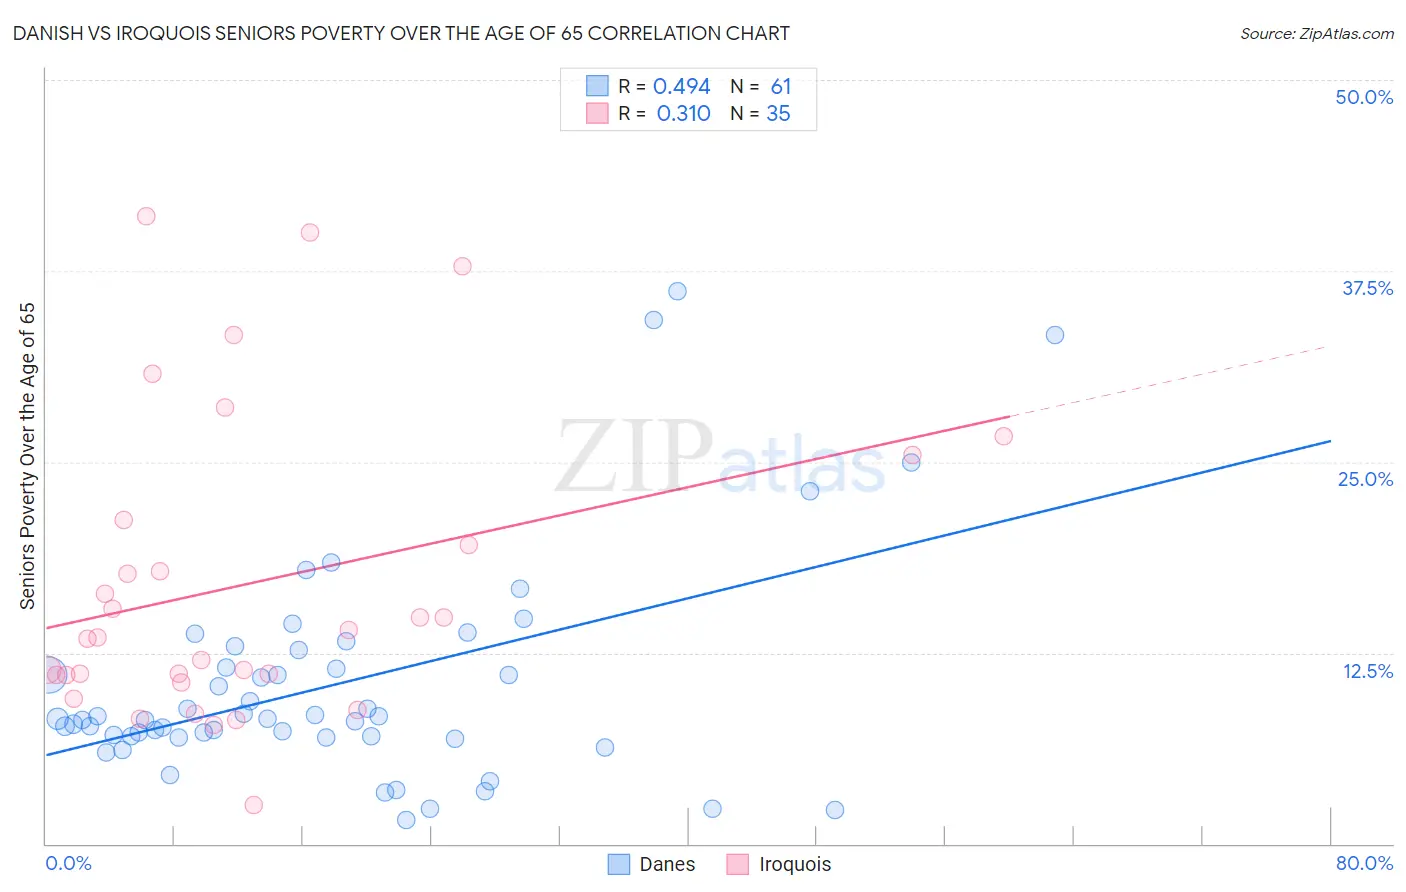
Danish vs Iroquois Seniors Poverty Over the Age of 65 Correlation Chart
The statistical analysis conducted on geographies consisting of 471,575,123 people shows a moderate positive correlation between the proportion of Danes and poverty level among seniors over the age of 65 in the United States with a correlation coefficient (R) of 0.494 and weighted average of 8.8%. Similarly, the statistical analysis conducted on geographies consisting of 206,867,848 people shows a mild positive correlation between the proportion of Iroquois and poverty level among seniors over the age of 65 in the United States with a correlation coefficient (R) of 0.310 and weighted average of 11.9%, a difference of 35.3%.
Seniors Poverty Over the Age of 65 Correlation Summary
| Measurement | Danish | Iroquois |
| Minimum | 1.6% | 2.5% |
| Maximum | 36.1% | 41.1% |
| Range | 34.5% | 38.6% |
| Mean | 10.4% | 17.0% |
| Median | 8.2% | 13.5% |
| Interquartile 25% (IQ1) | 7.0% | 11.0% |
| Interquartile 75% (IQ3) | 12.1% | 21.2% |
| Interquartile Range (IQR) | 5.1% | 10.1% |
| Standard Deviation (Sample) | 7.2% | 9.9% |
| Standard Deviation (Population) | 7.2% | 9.7% |
Similar Demographics by Seniors Poverty Over the Age of 65
Demographics Similar to Danes by Seniors Poverty Over the Age of 65
In terms of seniors poverty over the age of 65, the demographic groups most similar to Danes are Immigrants from India (8.8%, a difference of 0.45%), Swedish (8.7%, a difference of 0.81%), Norwegian (8.7%, a difference of 1.4%), German (9.0%, a difference of 1.6%), and Czech (9.0%, a difference of 2.1%).
| Demographics | Rating | Rank | Seniors Poverty Over the Age of 65 |
| Chinese | 100.0 /100 | #1 | Exceptional 8.3% |
| Tlingit-Haida | 100.0 /100 | #2 | Exceptional 8.3% |
| Norwegians | 100.0 /100 | #3 | Exceptional 8.7% |
| Swedes | 100.0 /100 | #4 | Exceptional 8.7% |
| Immigrants | India | 100.0 /100 | #5 | Exceptional 8.8% |
| Danes | 100.0 /100 | #6 | Exceptional 8.8% |
| Germans | 100.0 /100 | #7 | Exceptional 9.0% |
| Czechs | 100.0 /100 | #8 | Exceptional 9.0% |
| English | 100.0 /100 | #9 | Exceptional 9.1% |
| Lithuanians | 100.0 /100 | #10 | Exceptional 9.1% |
| Maltese | 99.9 /100 | #11 | Exceptional 9.1% |
| Scandinavians | 99.9 /100 | #12 | Exceptional 9.1% |
| Croatians | 99.9 /100 | #13 | Exceptional 9.1% |
| Poles | 99.9 /100 | #14 | Exceptional 9.1% |
| Dutch | 99.9 /100 | #15 | Exceptional 9.1% |
Demographics Similar to Iroquois by Seniors Poverty Over the Age of 65
In terms of seniors poverty over the age of 65, the demographic groups most similar to Iroquois are Panamanian (11.9%, a difference of 0.090%), Yaqui (11.9%, a difference of 0.19%), Cajun (11.9%, a difference of 0.33%), Bermudan (11.9%, a difference of 0.38%), and Immigrants from Argentina (12.0%, a difference of 0.50%).
| Demographics | Rating | Rank | Seniors Poverty Over the Age of 65 |
| Nigerians | 3.2 /100 | #227 | Tragic 11.8% |
| Immigrants | Costa Rica | 2.7 /100 | #228 | Tragic 11.8% |
| Immigrants | Eritrea | 2.6 /100 | #229 | Tragic 11.8% |
| Bermudans | 2.1 /100 | #230 | Tragic 11.9% |
| Cajuns | 2.0 /100 | #231 | Tragic 11.9% |
| Yaqui | 1.9 /100 | #232 | Tragic 11.9% |
| Panamanians | 1.8 /100 | #233 | Tragic 11.9% |
| Iroquois | 1.7 /100 | #234 | Tragic 11.9% |
| Immigrants | Argentina | 1.3 /100 | #235 | Tragic 12.0% |
| Immigrants | Peru | 1.3 /100 | #236 | Tragic 12.0% |
| Moroccans | 1.2 /100 | #237 | Tragic 12.0% |
| Seminole | 1.1 /100 | #238 | Tragic 12.0% |
| Immigrants | Spain | 1.0 /100 | #239 | Tragic 12.1% |
| Comanche | 0.9 /100 | #240 | Tragic 12.1% |
| Immigrants | Albania | 0.9 /100 | #241 | Tragic 12.1% |