Czech vs Immigrants from Senegal Child Poverty Under the Age of 16
COMPARE
Czech
Immigrants from Senegal
Child Poverty Under the Age of 16
Child Poverty Under the Age of 16 Comparison
Czechs
Immigrants from Senegal
13.8%
CHILD POVERTY UNDER THE AGE OF 16
99.3/ 100
METRIC RATING
45th/ 347
METRIC RANK
20.6%
CHILD POVERTY UNDER THE AGE OF 16
0.0/ 100
METRIC RATING
293rd/ 347
METRIC RANK
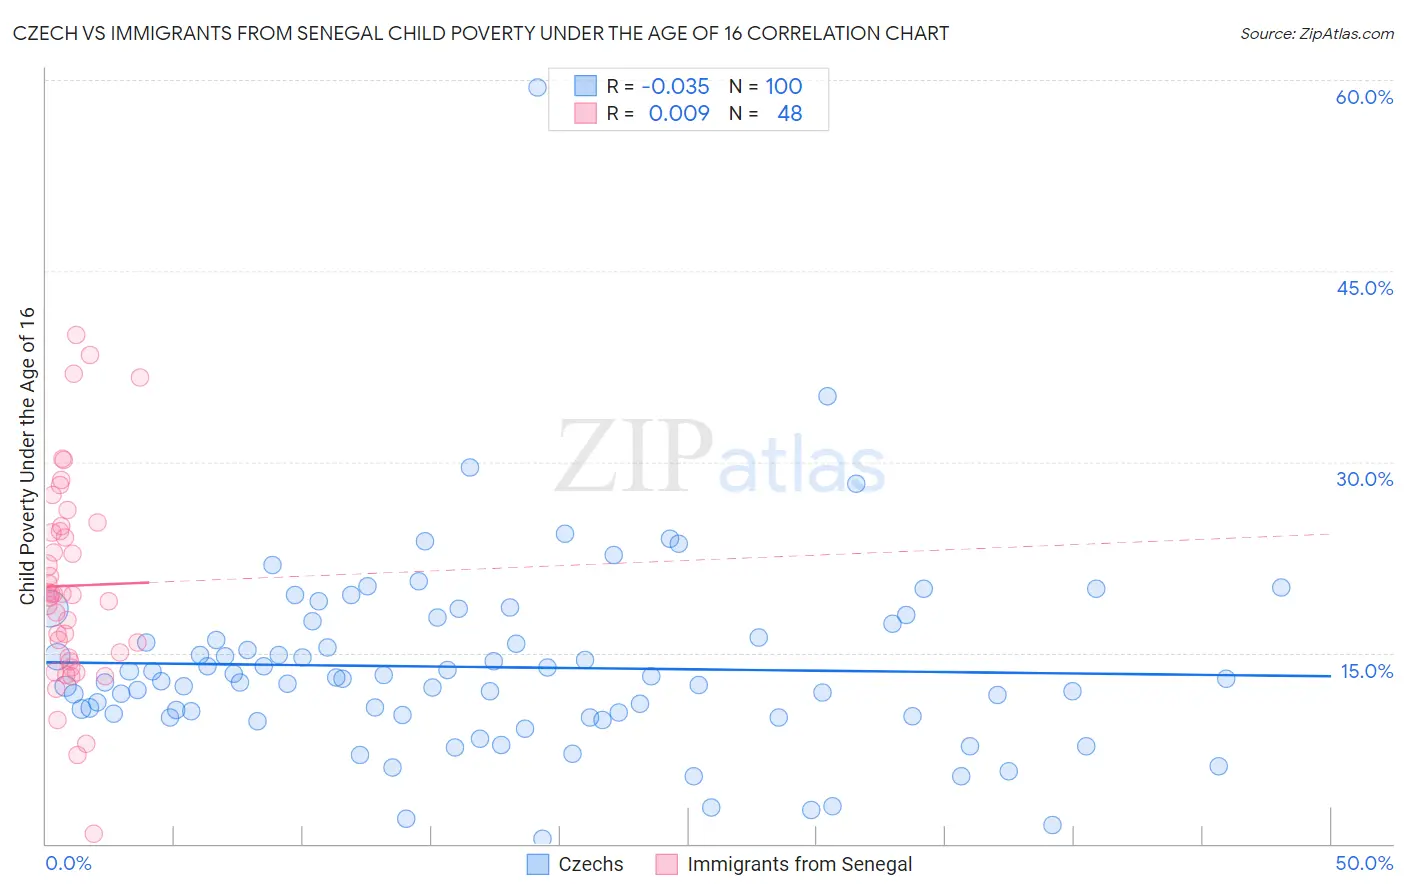
Czech vs Immigrants from Senegal Child Poverty Under the Age of 16 Correlation Chart
The statistical analysis conducted on geographies consisting of 477,035,895 people shows no correlation between the proportion of Czechs and poverty level among children under the age of 16 in the United States with a correlation coefficient (R) of -0.035 and weighted average of 13.8%. Similarly, the statistical analysis conducted on geographies consisting of 90,000,825 people shows no correlation between the proportion of Immigrants from Senegal and poverty level among children under the age of 16 in the United States with a correlation coefficient (R) of 0.009 and weighted average of 20.6%, a difference of 49.3%.
Child Poverty Under the Age of 16 Correlation Summary
| Measurement | Czech | Immigrants from Senegal |
| Minimum | 0.42% | 0.74% |
| Maximum | 59.4% | 40.0% |
| Range | 59.0% | 39.3% |
| Mean | 13.9% | 20.3% |
| Median | 12.8% | 19.6% |
| Interquartile 25% (IQ1) | 10.1% | 14.5% |
| Interquartile 75% (IQ3) | 16.7% | 24.8% |
| Interquartile Range (IQR) | 6.7% | 10.3% |
| Standard Deviation (Sample) | 7.6% | 8.2% |
| Standard Deviation (Population) | 7.6% | 8.1% |
Similar Demographics by Child Poverty Under the Age of 16
Demographics Similar to Czechs by Child Poverty Under the Age of 16
In terms of child poverty under the age of 16, the demographic groups most similar to Czechs are Greek (13.8%, a difference of 0.050%), Immigrants from Moldova (13.8%, a difference of 0.22%), Immigrants from Sri Lanka (13.8%, a difference of 0.29%), Immigrants from Asia (13.8%, a difference of 0.29%), and Croatian (13.8%, a difference of 0.37%).
| Demographics | Rating | Rank | Child Poverty Under the Age of 16 |
| Luxembourgers | 99.5 /100 | #38 | Exceptional 13.6% |
| Immigrants | Australia | 99.5 /100 | #39 | Exceptional 13.6% |
| Immigrants | Scotland | 99.4 /100 | #40 | Exceptional 13.7% |
| Croatians | 99.4 /100 | #41 | Exceptional 13.8% |
| Immigrants | Sri Lanka | 99.3 /100 | #42 | Exceptional 13.8% |
| Immigrants | Moldova | 99.3 /100 | #43 | Exceptional 13.8% |
| Greeks | 99.3 /100 | #44 | Exceptional 13.8% |
| Czechs | 99.3 /100 | #45 | Exceptional 13.8% |
| Immigrants | Asia | 99.2 /100 | #46 | Exceptional 13.8% |
| Estonians | 99.2 /100 | #47 | Exceptional 13.9% |
| Koreans | 99.2 /100 | #48 | Exceptional 13.9% |
| Italians | 99.2 /100 | #49 | Exceptional 13.9% |
| Immigrants | Czechoslovakia | 99.1 /100 | #50 | Exceptional 13.9% |
| Immigrants | Greece | 99.1 /100 | #51 | Exceptional 13.9% |
| Poles | 98.9 /100 | #52 | Exceptional 14.0% |
Demographics Similar to Immigrants from Senegal by Child Poverty Under the Age of 16
In terms of child poverty under the age of 16, the demographic groups most similar to Immigrants from Senegal are Haitian (20.7%, a difference of 0.21%), Mexican (20.7%, a difference of 0.34%), Immigrants from Latin America (20.5%, a difference of 0.43%), Chippewa (20.5%, a difference of 0.47%), and Immigrants from Caribbean (20.8%, a difference of 0.73%).
| Demographics | Rating | Rank | Child Poverty Under the Age of 16 |
| Immigrants | West Indies | 0.0 /100 | #286 | Tragic 20.2% |
| Blackfeet | 0.0 /100 | #287 | Tragic 20.2% |
| Immigrants | Belize | 0.0 /100 | #288 | Tragic 20.3% |
| Senegalese | 0.0 /100 | #289 | Tragic 20.4% |
| Yaqui | 0.0 /100 | #290 | Tragic 20.4% |
| Chippewa | 0.0 /100 | #291 | Tragic 20.5% |
| Immigrants | Latin America | 0.0 /100 | #292 | Tragic 20.5% |
| Immigrants | Senegal | 0.0 /100 | #293 | Tragic 20.6% |
| Haitians | 0.0 /100 | #294 | Tragic 20.7% |
| Mexicans | 0.0 /100 | #295 | Tragic 20.7% |
| Immigrants | Caribbean | 0.0 /100 | #296 | Tragic 20.8% |
| Hispanics or Latinos | 0.0 /100 | #297 | Tragic 20.8% |
| Arapaho | 0.0 /100 | #298 | Tragic 20.8% |
| Immigrants | Haiti | 0.0 /100 | #299 | Tragic 20.9% |
| Indonesians | 0.0 /100 | #300 | Tragic 21.0% |