Armenian vs Immigrants from Senegal Child Poverty Under the Age of 16
COMPARE
Armenian
Immigrants from Senegal
Child Poverty Under the Age of 16
Child Poverty Under the Age of 16 Comparison
Armenians
Immigrants from Senegal
15.2%
CHILD POVERTY UNDER THE AGE OF 16
89.4/ 100
METRIC RATING
131st/ 347
METRIC RANK
20.6%
CHILD POVERTY UNDER THE AGE OF 16
0.0/ 100
METRIC RATING
293rd/ 347
METRIC RANK
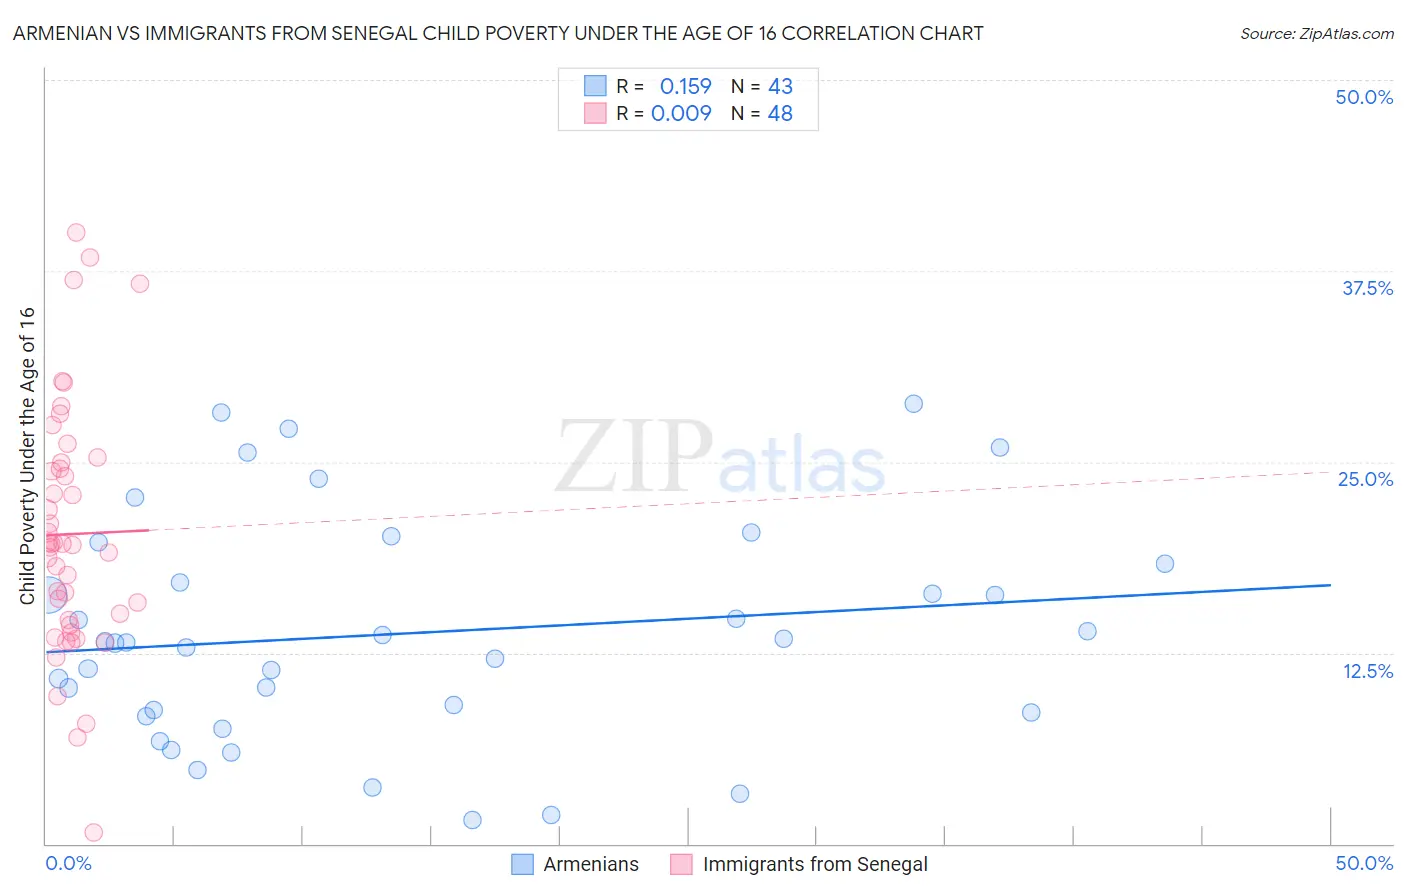
Armenian vs Immigrants from Senegal Child Poverty Under the Age of 16 Correlation Chart
The statistical analysis conducted on geographies consisting of 307,876,845 people shows a poor positive correlation between the proportion of Armenians and poverty level among children under the age of 16 in the United States with a correlation coefficient (R) of 0.159 and weighted average of 15.2%. Similarly, the statistical analysis conducted on geographies consisting of 90,000,825 people shows no correlation between the proportion of Immigrants from Senegal and poverty level among children under the age of 16 in the United States with a correlation coefficient (R) of 0.009 and weighted average of 20.6%, a difference of 35.9%.
Child Poverty Under the Age of 16 Correlation Summary
| Measurement | Armenian | Immigrants from Senegal |
| Minimum | 1.5% | 0.74% |
| Maximum | 28.8% | 40.0% |
| Range | 27.3% | 39.3% |
| Mean | 13.8% | 20.3% |
| Median | 13.2% | 19.6% |
| Interquartile 25% (IQ1) | 8.6% | 14.5% |
| Interquartile 75% (IQ3) | 18.3% | 24.8% |
| Interquartile Range (IQR) | 9.8% | 10.3% |
| Standard Deviation (Sample) | 7.2% | 8.2% |
| Standard Deviation (Population) | 7.2% | 8.1% |
Similar Demographics by Child Poverty Under the Age of 16
Demographics Similar to Armenians by Child Poverty Under the Age of 16
In terms of child poverty under the age of 16, the demographic groups most similar to Armenians are Mongolian (15.2%, a difference of 0.030%), Canadian (15.2%, a difference of 0.090%), Immigrants from Southern Europe (15.1%, a difference of 0.12%), Immigrants from South Eastern Asia (15.2%, a difference of 0.14%), and Native Hawaiian (15.2%, a difference of 0.23%).
| Demographics | Rating | Rank | Child Poverty Under the Age of 16 |
| Czechoslovakians | 91.0 /100 | #124 | Exceptional 15.1% |
| Palestinians | 90.9 /100 | #125 | Exceptional 15.1% |
| Portuguese | 90.6 /100 | #126 | Exceptional 15.1% |
| Immigrants | Western Europe | 90.3 /100 | #127 | Exceptional 15.1% |
| Immigrants | Kazakhstan | 90.2 /100 | #128 | Exceptional 15.1% |
| Immigrants | Southern Europe | 89.7 /100 | #129 | Excellent 15.1% |
| Mongolians | 89.5 /100 | #130 | Excellent 15.2% |
| Armenians | 89.4 /100 | #131 | Excellent 15.2% |
| Canadians | 89.1 /100 | #132 | Excellent 15.2% |
| Immigrants | South Eastern Asia | 89.0 /100 | #133 | Excellent 15.2% |
| Native Hawaiians | 88.7 /100 | #134 | Excellent 15.2% |
| Albanians | 88.6 /100 | #135 | Excellent 15.2% |
| Immigrants | Spain | 87.3 /100 | #136 | Excellent 15.3% |
| Peruvians | 87.2 /100 | #137 | Excellent 15.3% |
| Welsh | 87.2 /100 | #138 | Excellent 15.3% |
Demographics Similar to Immigrants from Senegal by Child Poverty Under the Age of 16
In terms of child poverty under the age of 16, the demographic groups most similar to Immigrants from Senegal are Haitian (20.7%, a difference of 0.21%), Mexican (20.7%, a difference of 0.34%), Immigrants from Latin America (20.5%, a difference of 0.43%), Chippewa (20.5%, a difference of 0.47%), and Immigrants from Caribbean (20.8%, a difference of 0.73%).
| Demographics | Rating | Rank | Child Poverty Under the Age of 16 |
| Immigrants | West Indies | 0.0 /100 | #286 | Tragic 20.2% |
| Blackfeet | 0.0 /100 | #287 | Tragic 20.2% |
| Immigrants | Belize | 0.0 /100 | #288 | Tragic 20.3% |
| Senegalese | 0.0 /100 | #289 | Tragic 20.4% |
| Yaqui | 0.0 /100 | #290 | Tragic 20.4% |
| Chippewa | 0.0 /100 | #291 | Tragic 20.5% |
| Immigrants | Latin America | 0.0 /100 | #292 | Tragic 20.5% |
| Immigrants | Senegal | 0.0 /100 | #293 | Tragic 20.6% |
| Haitians | 0.0 /100 | #294 | Tragic 20.7% |
| Mexicans | 0.0 /100 | #295 | Tragic 20.7% |
| Immigrants | Caribbean | 0.0 /100 | #296 | Tragic 20.8% |
| Hispanics or Latinos | 0.0 /100 | #297 | Tragic 20.8% |
| Arapaho | 0.0 /100 | #298 | Tragic 20.8% |
| Immigrants | Haiti | 0.0 /100 | #299 | Tragic 20.9% |
| Indonesians | 0.0 /100 | #300 | Tragic 21.0% |