Czech vs British Family Poverty
COMPARE
Czech
British
Family Poverty
Family Poverty Comparison
Czechs
British
7.4%
FAMILY POVERTY
99.6/ 100
METRIC RATING
31st/ 347
METRIC RANK
7.9%
FAMILY POVERTY
97.5/ 100
METRIC RATING
84th/ 347
METRIC RANK
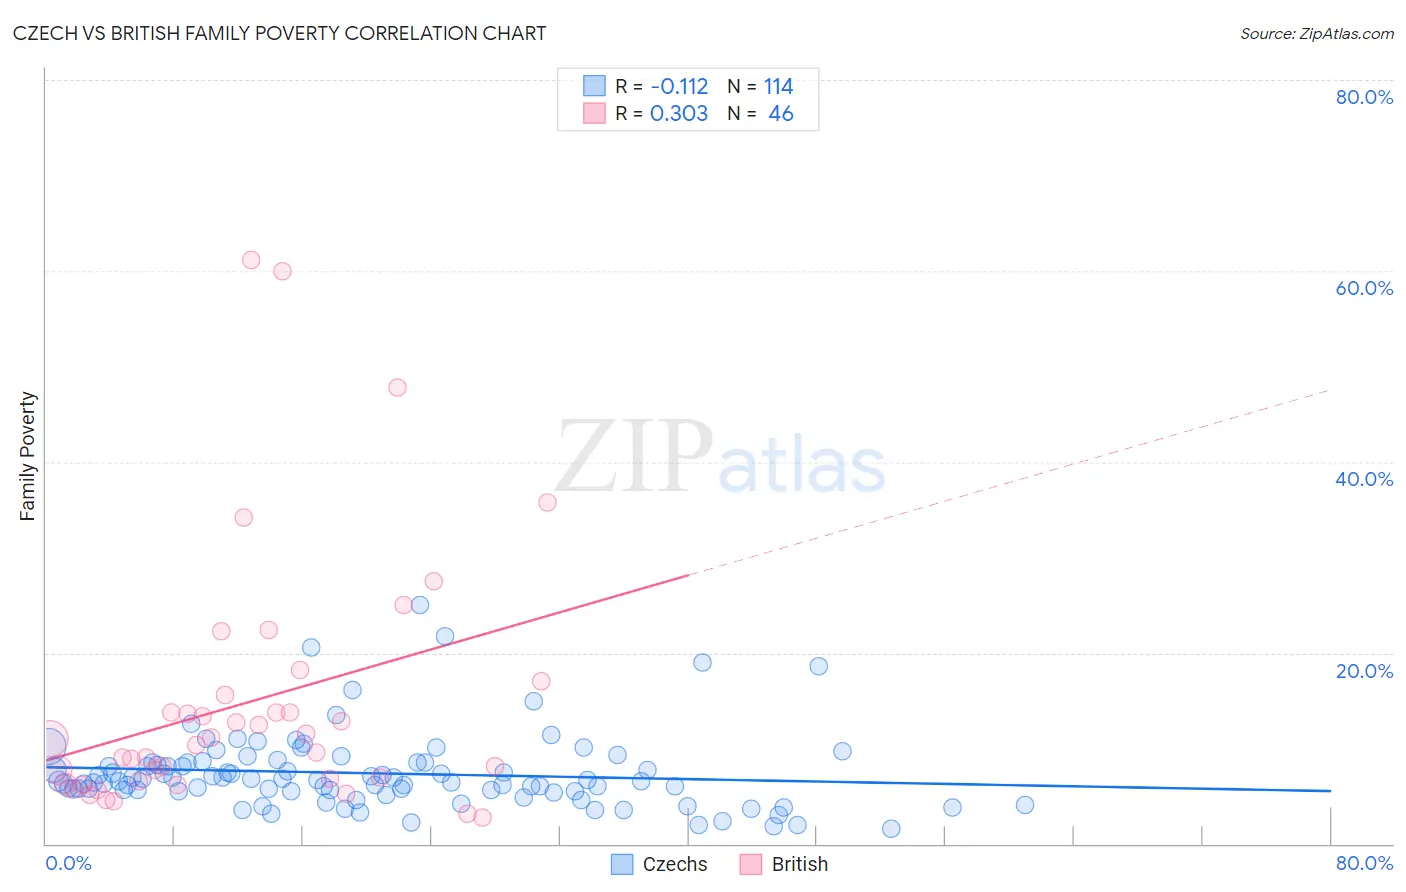
Czech vs British Family Poverty Correlation Chart
The statistical analysis conducted on geographies consisting of 482,390,324 people shows a poor negative correlation between the proportion of Czechs and poverty level among families in the United States with a correlation coefficient (R) of -0.112 and weighted average of 7.4%. Similarly, the statistical analysis conducted on geographies consisting of 528,449,567 people shows a mild positive correlation between the proportion of British and poverty level among families in the United States with a correlation coefficient (R) of 0.303 and weighted average of 7.9%, a difference of 6.9%.
Family Poverty Correlation Summary
| Measurement | Czech | British |
| Minimum | 1.6% | 2.7% |
| Maximum | 25.0% | 61.1% |
| Range | 23.4% | 58.4% |
| Mean | 7.4% | 14.8% |
| Median | 6.6% | 10.6% |
| Interquartile 25% (IQ1) | 5.5% | 6.6% |
| Interquartile 75% (IQ3) | 8.5% | 15.5% |
| Interquartile Range (IQR) | 3.0% | 9.0% |
| Standard Deviation (Sample) | 4.0% | 13.5% |
| Standard Deviation (Population) | 3.9% | 13.3% |
Similar Demographics by Family Poverty
Demographics Similar to Czechs by Family Poverty
In terms of family poverty, the demographic groups most similar to Czechs are Italian (7.4%, a difference of 0.12%), Polish (7.4%, a difference of 0.30%), Immigrants from Japan (7.4%, a difference of 0.30%), Immigrants from Northern Europe (7.4%, a difference of 0.41%), and Russian (7.5%, a difference of 0.53%).
| Demographics | Rating | Rank | Family Poverty |
| Croatians | 99.7 /100 | #24 | Exceptional 7.3% |
| Burmese | 99.7 /100 | #25 | Exceptional 7.3% |
| Cypriots | 99.6 /100 | #26 | Exceptional 7.3% |
| Immigrants | Scotland | 99.6 /100 | #27 | Exceptional 7.3% |
| Immigrants | Korea | 99.6 /100 | #28 | Exceptional 7.4% |
| Immigrants | Northern Europe | 99.6 /100 | #29 | Exceptional 7.4% |
| Italians | 99.6 /100 | #30 | Exceptional 7.4% |
| Czechs | 99.6 /100 | #31 | Exceptional 7.4% |
| Poles | 99.5 /100 | #32 | Exceptional 7.4% |
| Immigrants | Japan | 99.5 /100 | #33 | Exceptional 7.4% |
| Russians | 99.5 /100 | #34 | Exceptional 7.5% |
| Greeks | 99.4 /100 | #35 | Exceptional 7.5% |
| Turks | 99.4 /100 | #36 | Exceptional 7.5% |
| Estonians | 99.4 /100 | #37 | Exceptional 7.5% |
| Bolivians | 99.3 /100 | #38 | Exceptional 7.5% |
Demographics Similar to British by Family Poverty
In terms of family poverty, the demographic groups most similar to British are Slovak (7.9%, a difference of 0.24%), Immigrants from Asia (7.9%, a difference of 0.24%), Scottish (7.9%, a difference of 0.29%), Belgian (8.0%, a difference of 0.37%), and Immigrants from Poland (7.9%, a difference of 0.42%).
| Demographics | Rating | Rank | Family Poverty |
| Ukrainians | 98.0 /100 | #77 | Exceptional 7.9% |
| Immigrants | North America | 97.9 /100 | #78 | Exceptional 7.9% |
| Immigrants | Europe | 97.8 /100 | #79 | Exceptional 7.9% |
| English | 97.8 /100 | #80 | Exceptional 7.9% |
| Irish | 97.8 /100 | #81 | Exceptional 7.9% |
| Immigrants | Poland | 97.8 /100 | #82 | Exceptional 7.9% |
| Slovaks | 97.7 /100 | #83 | Exceptional 7.9% |
| British | 97.5 /100 | #84 | Exceptional 7.9% |
| Immigrants | Asia | 97.4 /100 | #85 | Exceptional 7.9% |
| Scottish | 97.3 /100 | #86 | Exceptional 7.9% |
| Belgians | 97.3 /100 | #87 | Exceptional 8.0% |
| Serbians | 97.2 /100 | #88 | Exceptional 8.0% |
| Immigrants | Denmark | 97.1 /100 | #89 | Exceptional 8.0% |
| Immigrants | England | 97.1 /100 | #90 | Exceptional 8.0% |
| Immigrants | Italy | 97.0 /100 | #91 | Exceptional 8.0% |