Bulgarian vs British Family Poverty
COMPARE
Bulgarian
British
Family Poverty
Family Poverty Comparison
Bulgarians
British
7.1%
FAMILY POVERTY
99.8/ 100
METRIC RATING
10th/ 347
METRIC RANK
7.9%
FAMILY POVERTY
97.5/ 100
METRIC RATING
84th/ 347
METRIC RANK
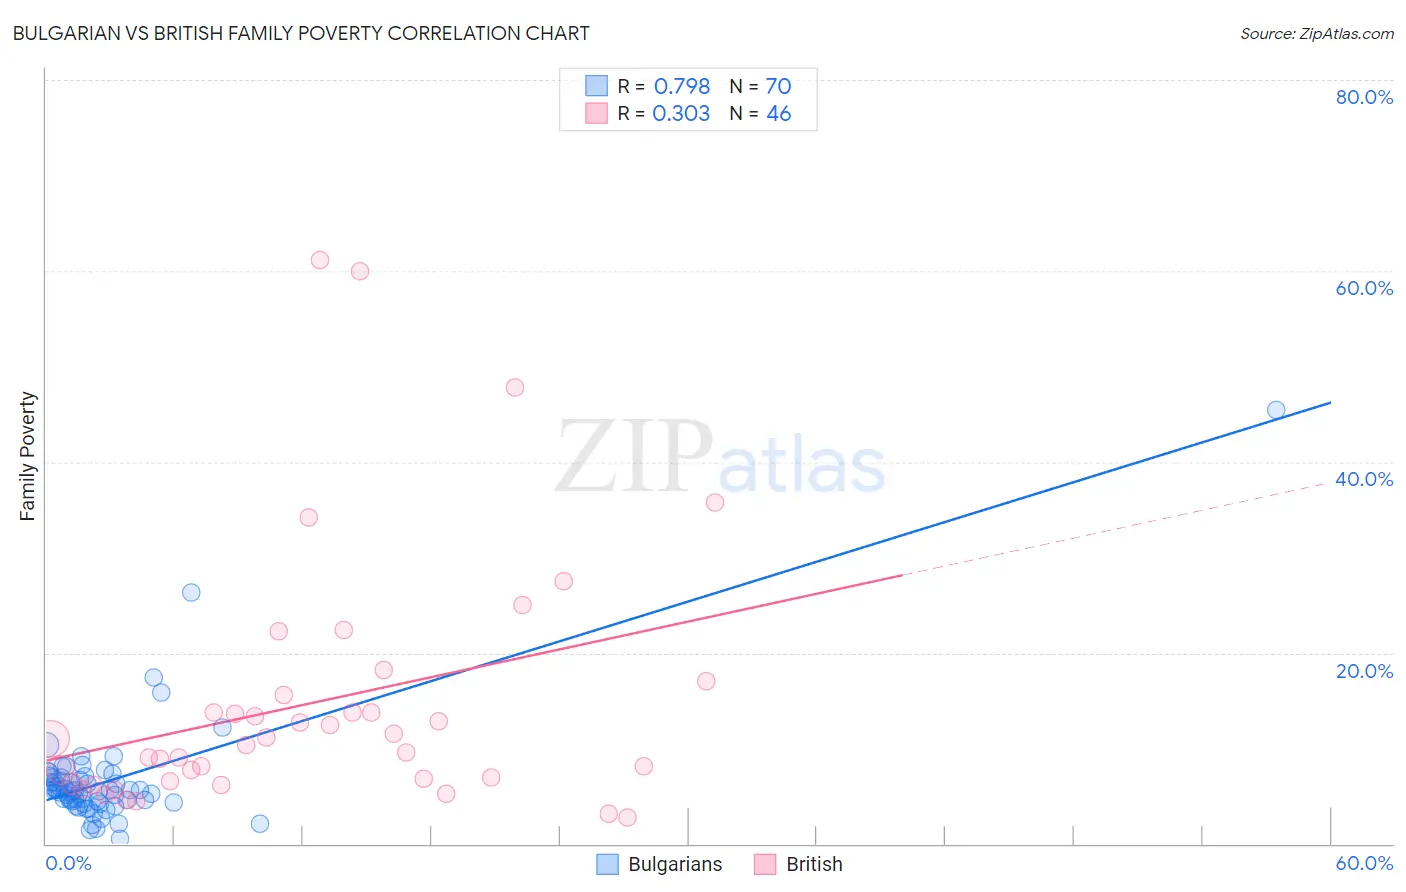
Bulgarian vs British Family Poverty Correlation Chart
The statistical analysis conducted on geographies consisting of 205,316,077 people shows a strong positive correlation between the proportion of Bulgarians and poverty level among families in the United States with a correlation coefficient (R) of 0.798 and weighted average of 7.1%. Similarly, the statistical analysis conducted on geographies consisting of 528,449,567 people shows a mild positive correlation between the proportion of British and poverty level among families in the United States with a correlation coefficient (R) of 0.303 and weighted average of 7.9%, a difference of 11.6%.
Family Poverty Correlation Summary
| Measurement | Bulgarian | British |
| Minimum | 0.55% | 2.7% |
| Maximum | 45.5% | 61.1% |
| Range | 44.9% | 58.4% |
| Mean | 6.7% | 14.8% |
| Median | 5.6% | 10.6% |
| Interquartile 25% (IQ1) | 4.4% | 6.6% |
| Interquartile 75% (IQ3) | 6.9% | 15.5% |
| Interquartile Range (IQR) | 2.5% | 9.0% |
| Standard Deviation (Sample) | 6.0% | 13.5% |
| Standard Deviation (Population) | 5.9% | 13.3% |
Similar Demographics by Family Poverty
Demographics Similar to Bulgarians by Family Poverty
In terms of family poverty, the demographic groups most similar to Bulgarians are Immigrants from Singapore (7.1%, a difference of 0.010%), Latvian (7.1%, a difference of 0.25%), Maltese (7.1%, a difference of 0.30%), Swedish (7.1%, a difference of 0.35%), and Iranian (7.1%, a difference of 0.36%).
| Demographics | Rating | Rank | Family Poverty |
| Immigrants | Taiwan | 100.0 /100 | #3 | Exceptional 6.6% |
| Filipinos | 100.0 /100 | #4 | Exceptional 6.6% |
| Thais | 100.0 /100 | #5 | Exceptional 6.7% |
| Norwegians | 99.9 /100 | #6 | Exceptional 6.9% |
| Immigrants | Ireland | 99.9 /100 | #7 | Exceptional 7.0% |
| Bhutanese | 99.9 /100 | #8 | Exceptional 7.0% |
| Latvians | 99.9 /100 | #9 | Exceptional 7.1% |
| Bulgarians | 99.8 /100 | #10 | Exceptional 7.1% |
| Immigrants | Singapore | 99.8 /100 | #11 | Exceptional 7.1% |
| Maltese | 99.8 /100 | #12 | Exceptional 7.1% |
| Swedes | 99.8 /100 | #13 | Exceptional 7.1% |
| Iranians | 99.8 /100 | #14 | Exceptional 7.1% |
| Lithuanians | 99.8 /100 | #15 | Exceptional 7.2% |
| Immigrants | South Central Asia | 99.8 /100 | #16 | Exceptional 7.2% |
| Luxembourgers | 99.8 /100 | #17 | Exceptional 7.2% |
Demographics Similar to British by Family Poverty
In terms of family poverty, the demographic groups most similar to British are Slovak (7.9%, a difference of 0.24%), Immigrants from Asia (7.9%, a difference of 0.24%), Scottish (7.9%, a difference of 0.29%), Belgian (8.0%, a difference of 0.37%), and Immigrants from Poland (7.9%, a difference of 0.42%).
| Demographics | Rating | Rank | Family Poverty |
| Ukrainians | 98.0 /100 | #77 | Exceptional 7.9% |
| Immigrants | North America | 97.9 /100 | #78 | Exceptional 7.9% |
| Immigrants | Europe | 97.8 /100 | #79 | Exceptional 7.9% |
| English | 97.8 /100 | #80 | Exceptional 7.9% |
| Irish | 97.8 /100 | #81 | Exceptional 7.9% |
| Immigrants | Poland | 97.8 /100 | #82 | Exceptional 7.9% |
| Slovaks | 97.7 /100 | #83 | Exceptional 7.9% |
| British | 97.5 /100 | #84 | Exceptional 7.9% |
| Immigrants | Asia | 97.4 /100 | #85 | Exceptional 7.9% |
| Scottish | 97.3 /100 | #86 | Exceptional 7.9% |
| Belgians | 97.3 /100 | #87 | Exceptional 8.0% |
| Serbians | 97.2 /100 | #88 | Exceptional 8.0% |
| Immigrants | Denmark | 97.1 /100 | #89 | Exceptional 8.0% |
| Immigrants | England | 97.1 /100 | #90 | Exceptional 8.0% |
| Immigrants | Italy | 97.0 /100 | #91 | Exceptional 8.0% |