Czech vs Basque Single Male Poverty
COMPARE
Czech
Basque
Single Male Poverty
Single Male Poverty Comparison
Czechs
Basques
13.5%
SINGLE MALE POVERTY
1.2/ 100
METRIC RATING
248th/ 347
METRIC RANK
13.0%
SINGLE MALE POVERTY
20.7/ 100
METRIC RATING
202nd/ 347
METRIC RANK
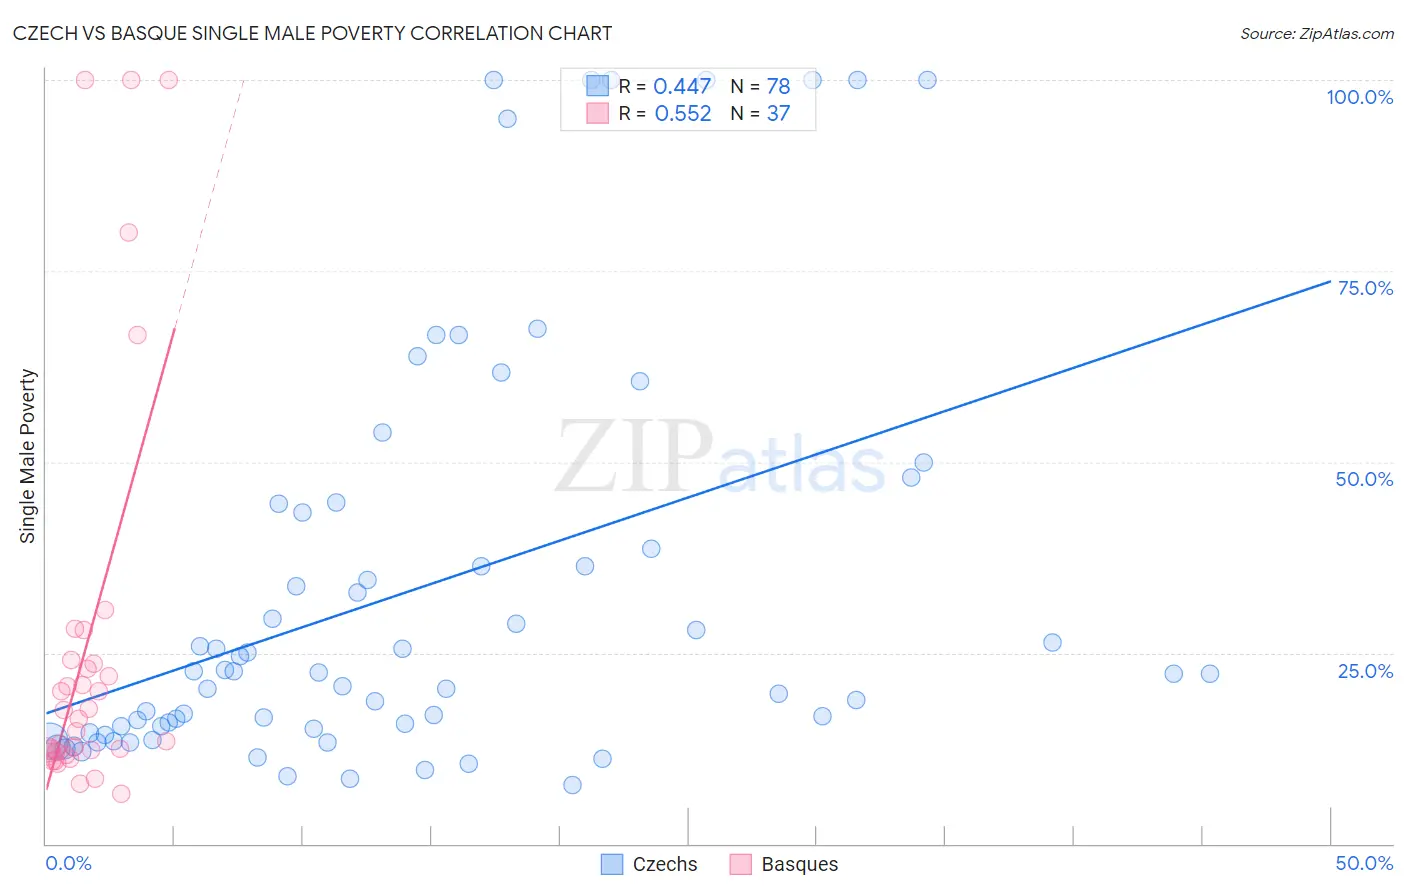
Czech vs Basque Single Male Poverty Correlation Chart
The statistical analysis conducted on geographies consisting of 410,747,171 people shows a moderate positive correlation between the proportion of Czechs and poverty level among single males in the United States with a correlation coefficient (R) of 0.447 and weighted average of 13.5%. Similarly, the statistical analysis conducted on geographies consisting of 155,521,610 people shows a substantial positive correlation between the proportion of Basques and poverty level among single males in the United States with a correlation coefficient (R) of 0.552 and weighted average of 13.0%, a difference of 4.0%.
Single Male Poverty Correlation Summary
| Measurement | Czech | Basque |
| Minimum | 7.7% | 6.6% |
| Maximum | 100.0% | 100.0% |
| Range | 92.3% | 93.4% |
| Mean | 33.2% | 26.0% |
| Median | 22.4% | 16.3% |
| Interquartile 25% (IQ1) | 15.1% | 12.0% |
| Interquartile 75% (IQ3) | 43.3% | 23.8% |
| Interquartile Range (IQR) | 28.3% | 11.8% |
| Standard Deviation (Sample) | 27.1% | 26.5% |
| Standard Deviation (Population) | 26.9% | 26.2% |
Similar Demographics by Single Male Poverty
Demographics Similar to Czechs by Single Male Poverty
In terms of single male poverty, the demographic groups most similar to Czechs are Belgian (13.5%, a difference of 0.030%), Immigrants from Micronesia (13.5%, a difference of 0.040%), Immigrants from Latin America (13.5%, a difference of 0.14%), Spanish (13.6%, a difference of 0.24%), and Immigrants from Somalia (13.6%, a difference of 0.26%).
| Demographics | Rating | Rank | Single Male Poverty |
| Immigrants | Germany | 2.1 /100 | #241 | Tragic 13.4% |
| Carpatho Rusyns | 2.1 /100 | #242 | Tragic 13.4% |
| Barbadians | 2.1 /100 | #243 | Tragic 13.4% |
| Immigrants | Senegal | 1.7 /100 | #244 | Tragic 13.5% |
| Immigrants | Latin America | 1.3 /100 | #245 | Tragic 13.5% |
| Immigrants | Micronesia | 1.2 /100 | #246 | Tragic 13.5% |
| Belgians | 1.2 /100 | #247 | Tragic 13.5% |
| Czechs | 1.2 /100 | #248 | Tragic 13.5% |
| Spanish | 1.0 /100 | #249 | Tragic 13.6% |
| Immigrants | Somalia | 1.0 /100 | #250 | Tragic 13.6% |
| Immigrants | Zaire | 0.9 /100 | #251 | Tragic 13.6% |
| Finns | 0.9 /100 | #252 | Tragic 13.6% |
| German Russians | 0.8 /100 | #253 | Tragic 13.6% |
| Sub-Saharan Africans | 0.5 /100 | #254 | Tragic 13.7% |
| Spaniards | 0.4 /100 | #255 | Tragic 13.7% |
Demographics Similar to Basques by Single Male Poverty
In terms of single male poverty, the demographic groups most similar to Basques are Immigrants from Bangladesh (13.0%, a difference of 0.030%), Estonian (13.0%, a difference of 0.030%), Trinidadian and Tobagonian (13.0%, a difference of 0.060%), Slovene (13.0%, a difference of 0.070%), and Immigrants from Norway (13.0%, a difference of 0.090%).
| Demographics | Rating | Rank | Single Male Poverty |
| Immigrants | England | 23.4 /100 | #195 | Fair 13.0% |
| Immigrants | Grenada | 23.1 /100 | #196 | Fair 13.0% |
| Immigrants | Laos | 23.1 /100 | #197 | Fair 13.0% |
| Lithuanians | 22.1 /100 | #198 | Fair 13.0% |
| Immigrants | Norway | 21.8 /100 | #199 | Fair 13.0% |
| Slovenes | 21.6 /100 | #200 | Fair 13.0% |
| Trinidadians and Tobagonians | 21.4 /100 | #201 | Fair 13.0% |
| Basques | 20.7 /100 | #202 | Fair 13.0% |
| Immigrants | Bangladesh | 20.4 /100 | #203 | Fair 13.0% |
| Estonians | 20.3 /100 | #204 | Fair 13.0% |
| Poles | 19.3 /100 | #205 | Poor 13.0% |
| Northern Europeans | 18.9 /100 | #206 | Poor 13.0% |
| Sudanese | 17.7 /100 | #207 | Poor 13.1% |
| Immigrants | Western Africa | 17.6 /100 | #208 | Poor 13.1% |
| Mexican American Indians | 17.5 /100 | #209 | Poor 13.1% |