Czech vs Australian Single Male Poverty
COMPARE
Czech
Australian
Single Male Poverty
Single Male Poverty Comparison
Czechs
Australians
13.5%
SINGLE MALE POVERTY
1.2/ 100
METRIC RATING
248th/ 347
METRIC RANK
12.6%
SINGLE MALE POVERTY
71.4/ 100
METRIC RATING
152nd/ 347
METRIC RANK
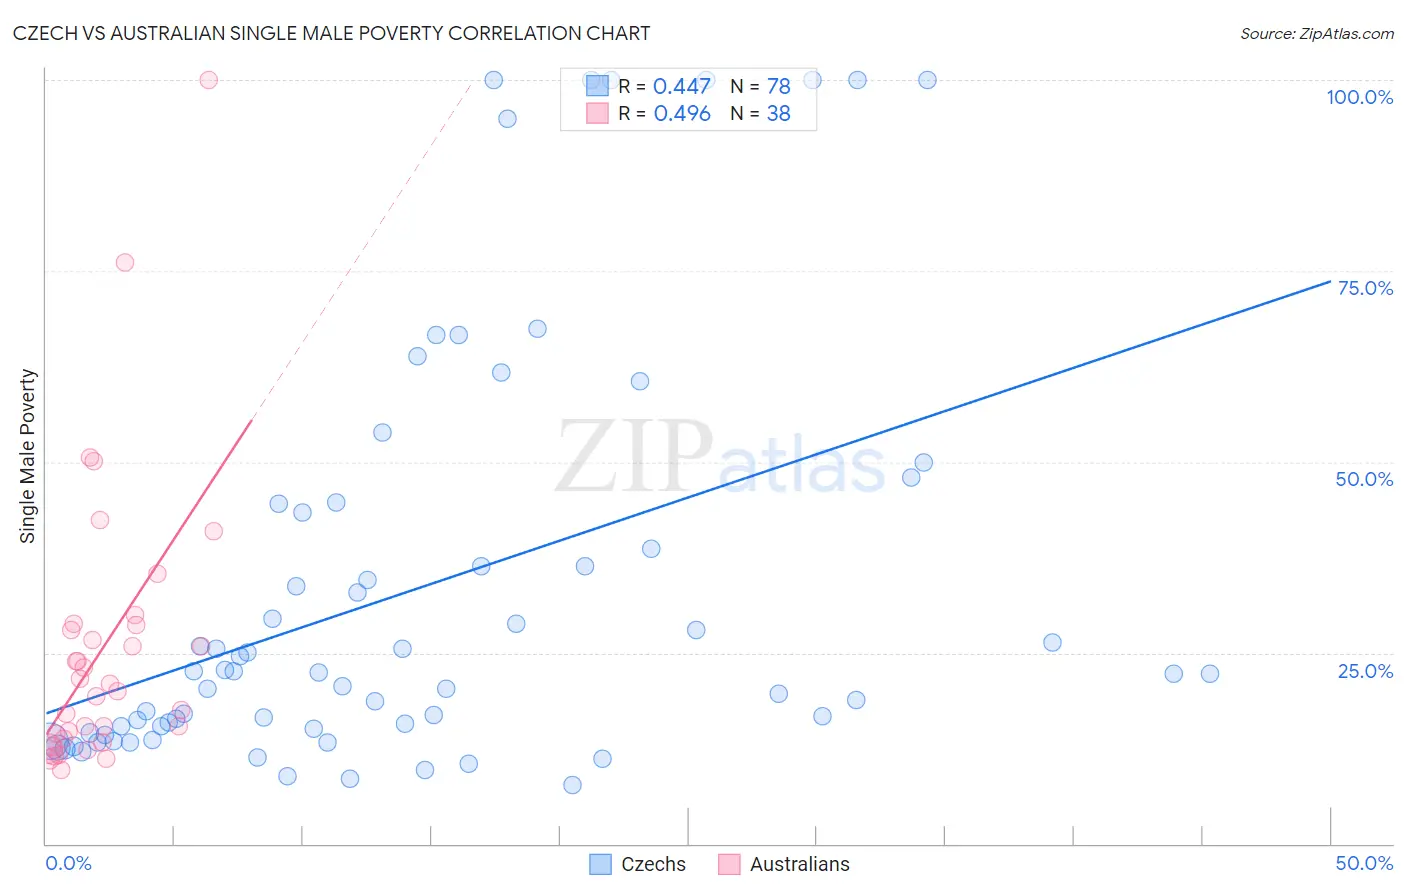
Czech vs Australian Single Male Poverty Correlation Chart
The statistical analysis conducted on geographies consisting of 410,747,171 people shows a moderate positive correlation between the proportion of Czechs and poverty level among single males in the United States with a correlation coefficient (R) of 0.447 and weighted average of 13.5%. Similarly, the statistical analysis conducted on geographies consisting of 203,982,275 people shows a moderate positive correlation between the proportion of Australians and poverty level among single males in the United States with a correlation coefficient (R) of 0.496 and weighted average of 12.6%, a difference of 7.1%.
Single Male Poverty Correlation Summary
| Measurement | Czech | Australian |
| Minimum | 7.7% | 9.6% |
| Maximum | 100.0% | 100.0% |
| Range | 92.3% | 90.4% |
| Mean | 33.2% | 25.6% |
| Median | 22.4% | 20.5% |
| Interquartile 25% (IQ1) | 15.1% | 13.8% |
| Interquartile 75% (IQ3) | 43.3% | 28.6% |
| Interquartile Range (IQR) | 28.3% | 14.7% |
| Standard Deviation (Sample) | 27.1% | 18.5% |
| Standard Deviation (Population) | 26.9% | 18.3% |
Similar Demographics by Single Male Poverty
Demographics Similar to Czechs by Single Male Poverty
In terms of single male poverty, the demographic groups most similar to Czechs are Belgian (13.5%, a difference of 0.030%), Immigrants from Micronesia (13.5%, a difference of 0.040%), Immigrants from Latin America (13.5%, a difference of 0.14%), Spanish (13.6%, a difference of 0.24%), and Immigrants from Somalia (13.6%, a difference of 0.26%).
| Demographics | Rating | Rank | Single Male Poverty |
| Immigrants | Germany | 2.1 /100 | #241 | Tragic 13.4% |
| Carpatho Rusyns | 2.1 /100 | #242 | Tragic 13.4% |
| Barbadians | 2.1 /100 | #243 | Tragic 13.4% |
| Immigrants | Senegal | 1.7 /100 | #244 | Tragic 13.5% |
| Immigrants | Latin America | 1.3 /100 | #245 | Tragic 13.5% |
| Immigrants | Micronesia | 1.2 /100 | #246 | Tragic 13.5% |
| Belgians | 1.2 /100 | #247 | Tragic 13.5% |
| Czechs | 1.2 /100 | #248 | Tragic 13.5% |
| Spanish | 1.0 /100 | #249 | Tragic 13.6% |
| Immigrants | Somalia | 1.0 /100 | #250 | Tragic 13.6% |
| Immigrants | Zaire | 0.9 /100 | #251 | Tragic 13.6% |
| Finns | 0.9 /100 | #252 | Tragic 13.6% |
| German Russians | 0.8 /100 | #253 | Tragic 13.6% |
| Sub-Saharan Africans | 0.5 /100 | #254 | Tragic 13.7% |
| Spaniards | 0.4 /100 | #255 | Tragic 13.7% |
Demographics Similar to Australians by Single Male Poverty
In terms of single male poverty, the demographic groups most similar to Australians are Immigrants from Hungary (12.6%, a difference of 0.030%), Immigrants from Panama (12.6%, a difference of 0.050%), Immigrants (12.7%, a difference of 0.080%), Sierra Leonean (12.6%, a difference of 0.11%), and Immigrants from Scotland (12.7%, a difference of 0.16%).
| Demographics | Rating | Rank | Single Male Poverty |
| Immigrants | Lebanon | 75.0 /100 | #145 | Good 12.6% |
| Native Hawaiians | 75.0 /100 | #146 | Good 12.6% |
| Malaysians | 74.8 /100 | #147 | Good 12.6% |
| Yugoslavians | 73.9 /100 | #148 | Good 12.6% |
| Sierra Leoneans | 73.0 /100 | #149 | Good 12.6% |
| Immigrants | Panama | 72.1 /100 | #150 | Good 12.6% |
| Immigrants | Hungary | 71.9 /100 | #151 | Good 12.6% |
| Australians | 71.4 /100 | #152 | Good 12.6% |
| Immigrants | Immigrants | 70.1 /100 | #153 | Good 12.7% |
| Immigrants | Scotland | 68.9 /100 | #154 | Good 12.7% |
| Immigrants | Spain | 68.7 /100 | #155 | Good 12.7% |
| Vietnamese | 67.9 /100 | #156 | Good 12.7% |
| Latvians | 67.9 /100 | #157 | Good 12.7% |
| Immigrants | Middle Africa | 64.9 /100 | #158 | Good 12.7% |
| Immigrants | Liberia | 64.2 /100 | #159 | Good 12.7% |