Czechoslovakian vs Immigrants from Spain Male Poverty
COMPARE
Czechoslovakian
Immigrants from Spain
Male Poverty
Male Poverty Comparison
Czechoslovakians
Immigrants from Spain
10.3%
MALE POVERTY
95.6/ 100
METRIC RATING
84th/ 347
METRIC RANK
11.1%
MALE POVERTY
55.5/ 100
METRIC RATING
165th/ 347
METRIC RANK
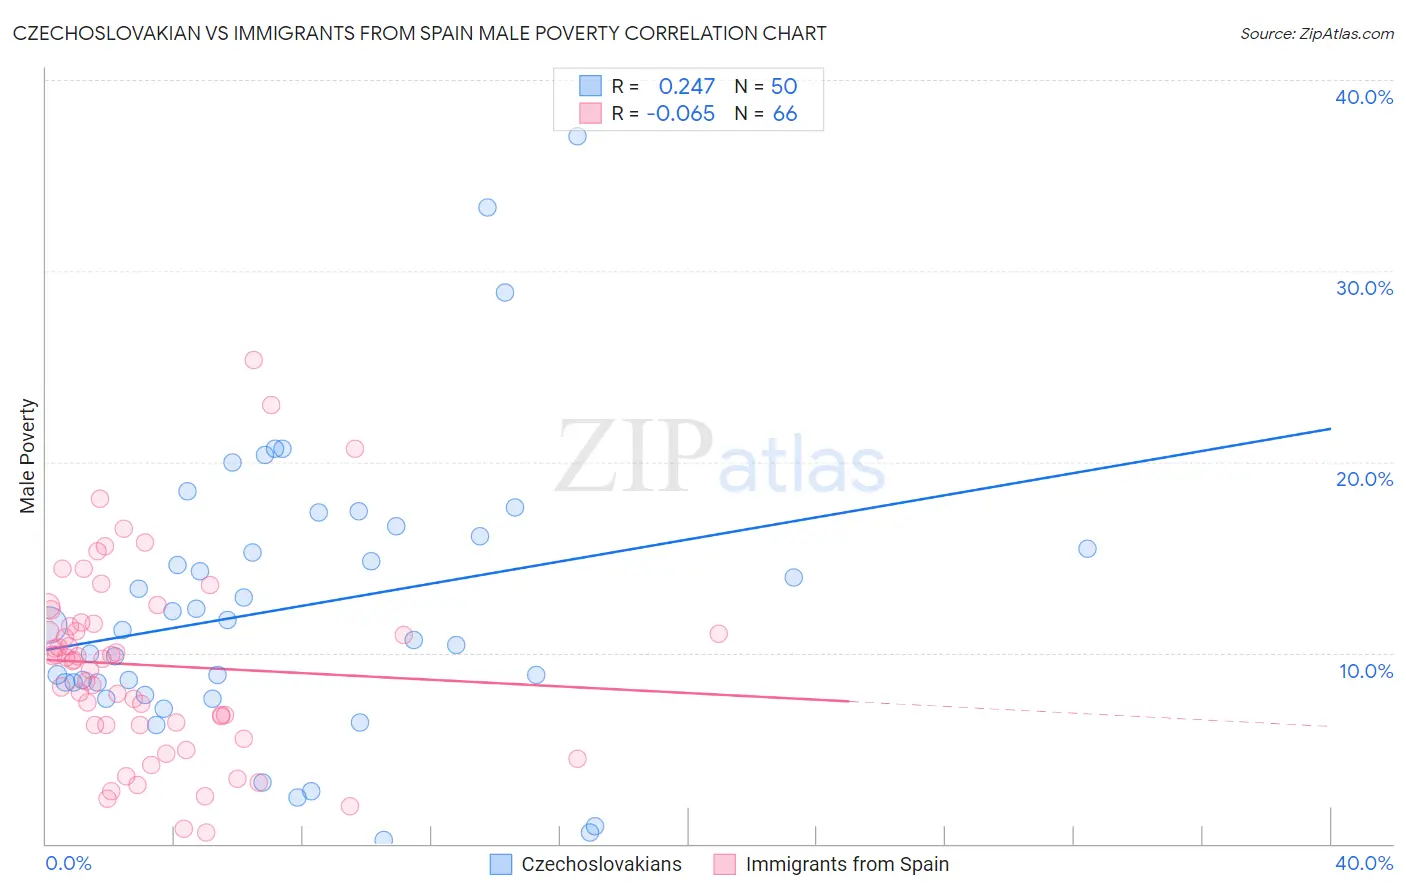
Czechoslovakian vs Immigrants from Spain Male Poverty Correlation Chart
The statistical analysis conducted on geographies consisting of 368,409,681 people shows a weak positive correlation between the proportion of Czechoslovakians and poverty level among males in the United States with a correlation coefficient (R) of 0.247 and weighted average of 10.3%. Similarly, the statistical analysis conducted on geographies consisting of 239,541,780 people shows a slight negative correlation between the proportion of Immigrants from Spain and poverty level among males in the United States with a correlation coefficient (R) of -0.065 and weighted average of 11.1%, a difference of 7.5%.
Male Poverty Correlation Summary
| Measurement | Czechoslovakian | Immigrants from Spain |
| Minimum | 0.22% | 0.62% |
| Maximum | 37.0% | 25.4% |
| Range | 36.8% | 24.7% |
| Mean | 12.4% | 9.4% |
| Median | 11.3% | 9.7% |
| Interquartile 25% (IQ1) | 8.4% | 6.2% |
| Interquartile 75% (IQ3) | 16.1% | 11.6% |
| Interquartile Range (IQR) | 7.7% | 5.3% |
| Standard Deviation (Sample) | 7.5% | 5.0% |
| Standard Deviation (Population) | 7.4% | 5.0% |
Similar Demographics by Male Poverty
Demographics Similar to Czechoslovakians by Male Poverty
In terms of male poverty, the demographic groups most similar to Czechoslovakians are Immigrants from England (10.4%, a difference of 0.050%), Immigrants from Sweden (10.3%, a difference of 0.060%), Immigrants from Eastern Asia (10.4%, a difference of 0.18%), Belgian (10.3%, a difference of 0.19%), and Egyptian (10.3%, a difference of 0.19%).
| Demographics | Rating | Rank | Male Poverty |
| Immigrants | Belgium | 96.8 /100 | #77 | Exceptional 10.3% |
| Irish | 96.8 /100 | #78 | Exceptional 10.3% |
| Immigrants | North America | 96.5 /100 | #79 | Exceptional 10.3% |
| English | 96.4 /100 | #80 | Exceptional 10.3% |
| Belgians | 95.9 /100 | #81 | Exceptional 10.3% |
| Egyptians | 95.9 /100 | #82 | Exceptional 10.3% |
| Immigrants | Sweden | 95.7 /100 | #83 | Exceptional 10.3% |
| Czechoslovakians | 95.6 /100 | #84 | Exceptional 10.3% |
| Immigrants | England | 95.5 /100 | #85 | Exceptional 10.4% |
| Immigrants | Eastern Asia | 95.3 /100 | #86 | Exceptional 10.4% |
| Northern Europeans | 95.2 /100 | #87 | Exceptional 10.4% |
| Cambodians | 95.0 /100 | #88 | Exceptional 10.4% |
| Immigrants | Denmark | 95.0 /100 | #89 | Exceptional 10.4% |
| Indians (Asian) | 94.9 /100 | #90 | Exceptional 10.4% |
| British | 94.8 /100 | #91 | Exceptional 10.4% |
Demographics Similar to Immigrants from Spain by Male Poverty
In terms of male poverty, the demographic groups most similar to Immigrants from Spain are Immigrants from Albania (11.1%, a difference of 0.020%), Hungarian (11.1%, a difference of 0.040%), Immigrants from Portugal (11.1%, a difference of 0.060%), White/Caucasian (11.1%, a difference of 0.12%), and Ethiopian (11.1%, a difference of 0.12%).
| Demographics | Rating | Rank | Male Poverty |
| Colombians | 63.0 /100 | #158 | Good 11.0% |
| Taiwanese | 62.7 /100 | #159 | Good 11.0% |
| Soviet Union | 60.3 /100 | #160 | Good 11.1% |
| Immigrants | Northern Africa | 59.7 /100 | #161 | Average 11.1% |
| Immigrants | Chile | 57.4 /100 | #162 | Average 11.1% |
| Whites/Caucasians | 56.7 /100 | #163 | Average 11.1% |
| Ethiopians | 56.7 /100 | #164 | Average 11.1% |
| Immigrants | Spain | 55.5 /100 | #165 | Average 11.1% |
| Immigrants | Albania | 55.3 /100 | #166 | Average 11.1% |
| Hungarians | 55.1 /100 | #167 | Average 11.1% |
| Immigrants | Portugal | 54.9 /100 | #168 | Average 11.1% |
| Immigrants | Colombia | 54.2 /100 | #169 | Average 11.1% |
| South Americans | 53.8 /100 | #170 | Average 11.1% |
| Uruguayans | 51.0 /100 | #171 | Average 11.2% |
| Immigrants | Ethiopia | 50.7 /100 | #172 | Average 11.2% |