Cuban vs Polish Single Female Poverty
COMPARE
Cuban
Polish
Single Female Poverty
Single Female Poverty Comparison
Cubans
Poles
21.0%
SINGLE FEMALE POVERTY
50.0/ 100
METRIC RATING
174th/ 347
METRIC RANK
20.0%
SINGLE FEMALE POVERTY
95.6/ 100
METRIC RATING
117th/ 347
METRIC RANK
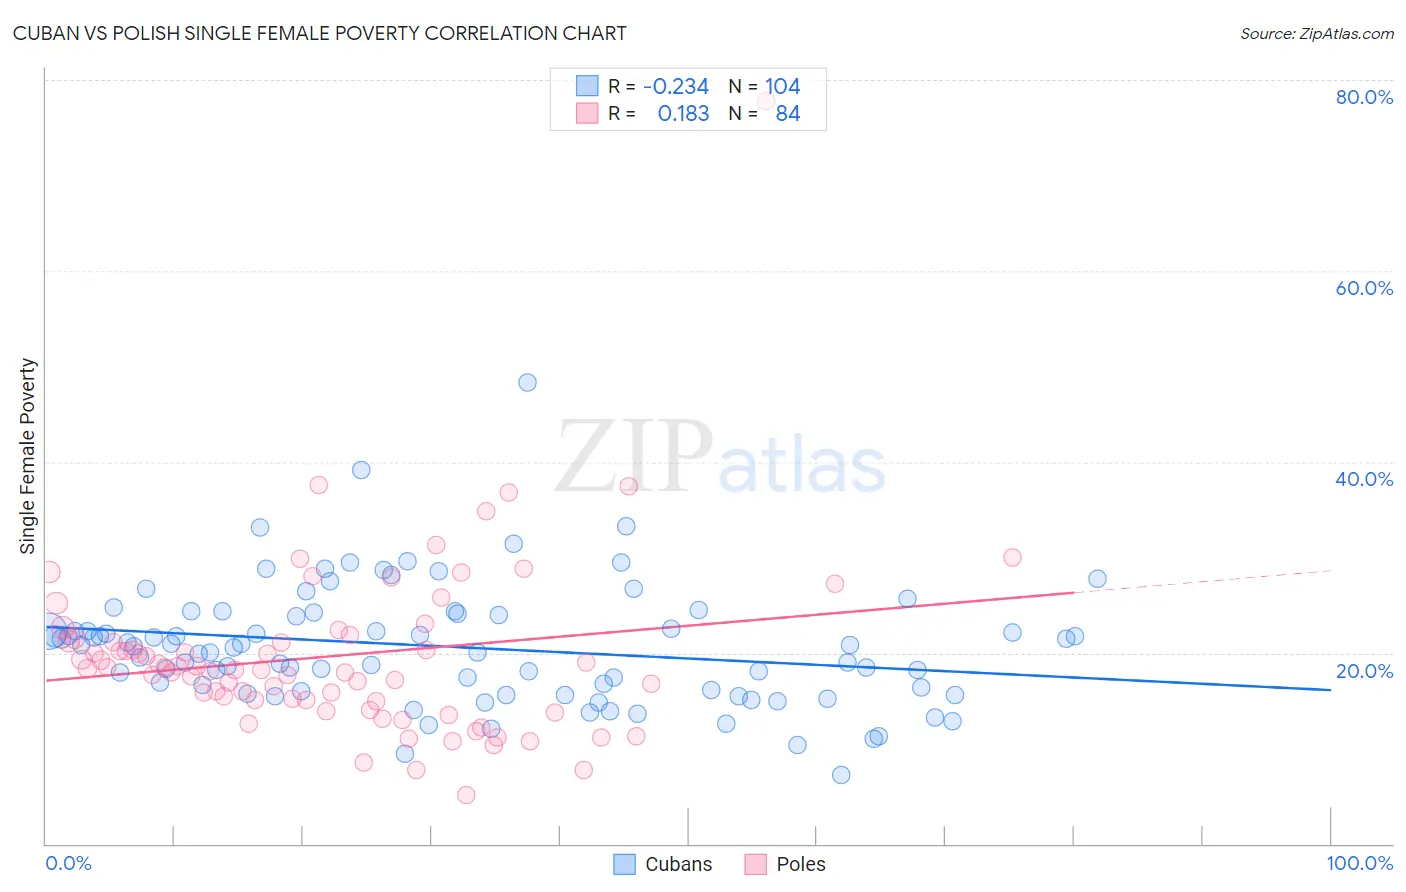
Cuban vs Polish Single Female Poverty Correlation Chart
The statistical analysis conducted on geographies consisting of 441,584,431 people shows a weak negative correlation between the proportion of Cubans and poverty level among single females in the United States with a correlation coefficient (R) of -0.234 and weighted average of 21.0%. Similarly, the statistical analysis conducted on geographies consisting of 540,648,270 people shows a poor positive correlation between the proportion of Poles and poverty level among single females in the United States with a correlation coefficient (R) of 0.183 and weighted average of 20.0%, a difference of 5.0%.
Single Female Poverty Correlation Summary
| Measurement | Cuban | Polish |
| Minimum | 7.2% | 5.1% |
| Maximum | 48.3% | 77.8% |
| Range | 41.1% | 72.7% |
| Mean | 20.6% | 19.6% |
| Median | 20.6% | 18.3% |
| Interquartile 25% (IQ1) | 16.0% | 15.0% |
| Interquartile 75% (IQ3) | 24.0% | 21.4% |
| Interquartile Range (IQR) | 8.0% | 6.4% |
| Standard Deviation (Sample) | 6.3% | 9.3% |
| Standard Deviation (Population) | 6.3% | 9.3% |
Similar Demographics by Single Female Poverty
Demographics Similar to Cubans by Single Female Poverty
In terms of single female poverty, the demographic groups most similar to Cubans are Immigrants from Guyana (21.0%, a difference of 0.040%), Guyanese (21.0%, a difference of 0.13%), Moroccan (21.0%, a difference of 0.17%), New Zealander (21.0%, a difference of 0.20%), and Czech (21.0%, a difference of 0.20%).
| Demographics | Rating | Rank | Single Female Poverty |
| Immigrants | Norway | 63.0 /100 | #167 | Good 20.8% |
| Immigrants | Costa Rica | 61.5 /100 | #168 | Good 20.9% |
| Immigrants | Trinidad and Tobago | 56.3 /100 | #169 | Average 20.9% |
| New Zealanders | 53.2 /100 | #170 | Average 21.0% |
| Moroccans | 52.8 /100 | #171 | Average 21.0% |
| Guyanese | 52.0 /100 | #172 | Average 21.0% |
| Immigrants | Guyana | 50.6 /100 | #173 | Average 21.0% |
| Cubans | 50.0 /100 | #174 | Average 21.0% |
| Czechs | 46.8 /100 | #175 | Average 21.0% |
| Canadians | 45.4 /100 | #176 | Average 21.1% |
| Scandinavians | 45.2 /100 | #177 | Average 21.1% |
| Immigrants | Bosnia and Herzegovina | 44.9 /100 | #178 | Average 21.1% |
| British | 42.9 /100 | #179 | Average 21.1% |
| Spanish American Indians | 42.5 /100 | #180 | Average 21.1% |
| Europeans | 42.3 /100 | #181 | Average 21.1% |
Demographics Similar to Poles by Single Female Poverty
In terms of single female poverty, the demographic groups most similar to Poles are Immigrants from Kazakhstan (20.0%, a difference of 0.050%), Immigrants from Northern Africa (20.0%, a difference of 0.080%), Immigrants from Afghanistan (20.0%, a difference of 0.080%), Immigrants from Ethiopia (20.0%, a difference of 0.080%), and Immigrants from Zimbabwe (20.0%, a difference of 0.10%).
| Demographics | Rating | Rank | Single Female Poverty |
| Immigrants | Western Asia | 96.5 /100 | #110 | Exceptional 19.9% |
| Carpatho Rusyns | 96.1 /100 | #111 | Exceptional 20.0% |
| Immigrants | Netherlands | 96.0 /100 | #112 | Exceptional 20.0% |
| Immigrants | Zimbabwe | 95.9 /100 | #113 | Exceptional 20.0% |
| Immigrants | Colombia | 95.9 /100 | #114 | Exceptional 20.0% |
| Immigrants | Northern Africa | 95.8 /100 | #115 | Exceptional 20.0% |
| Immigrants | Kazakhstan | 95.7 /100 | #116 | Exceptional 20.0% |
| Poles | 95.6 /100 | #117 | Exceptional 20.0% |
| Immigrants | Afghanistan | 95.4 /100 | #118 | Exceptional 20.0% |
| Immigrants | Ethiopia | 95.4 /100 | #119 | Exceptional 20.0% |
| South Americans | 95.1 /100 | #120 | Exceptional 20.0% |
| Immigrants | Switzerland | 95.1 /100 | #121 | Exceptional 20.0% |
| Immigrants | South America | 95.0 /100 | #122 | Exceptional 20.0% |
| Brazilians | 94.4 /100 | #123 | Exceptional 20.1% |
| Immigrants | Chile | 94.3 /100 | #124 | Exceptional 20.1% |