Cree vs Yuman Single Mother Poverty
COMPARE
Cree
Yuman
Single Mother Poverty
Single Mother Poverty Comparison
Cree
Yuman
32.2%
SINGLE MOTHER POVERTY
0.0/ 100
METRIC RATING
281st/ 347
METRIC RANK
37.8%
SINGLE MOTHER POVERTY
0.0/ 100
METRIC RATING
335th/ 347
METRIC RANK
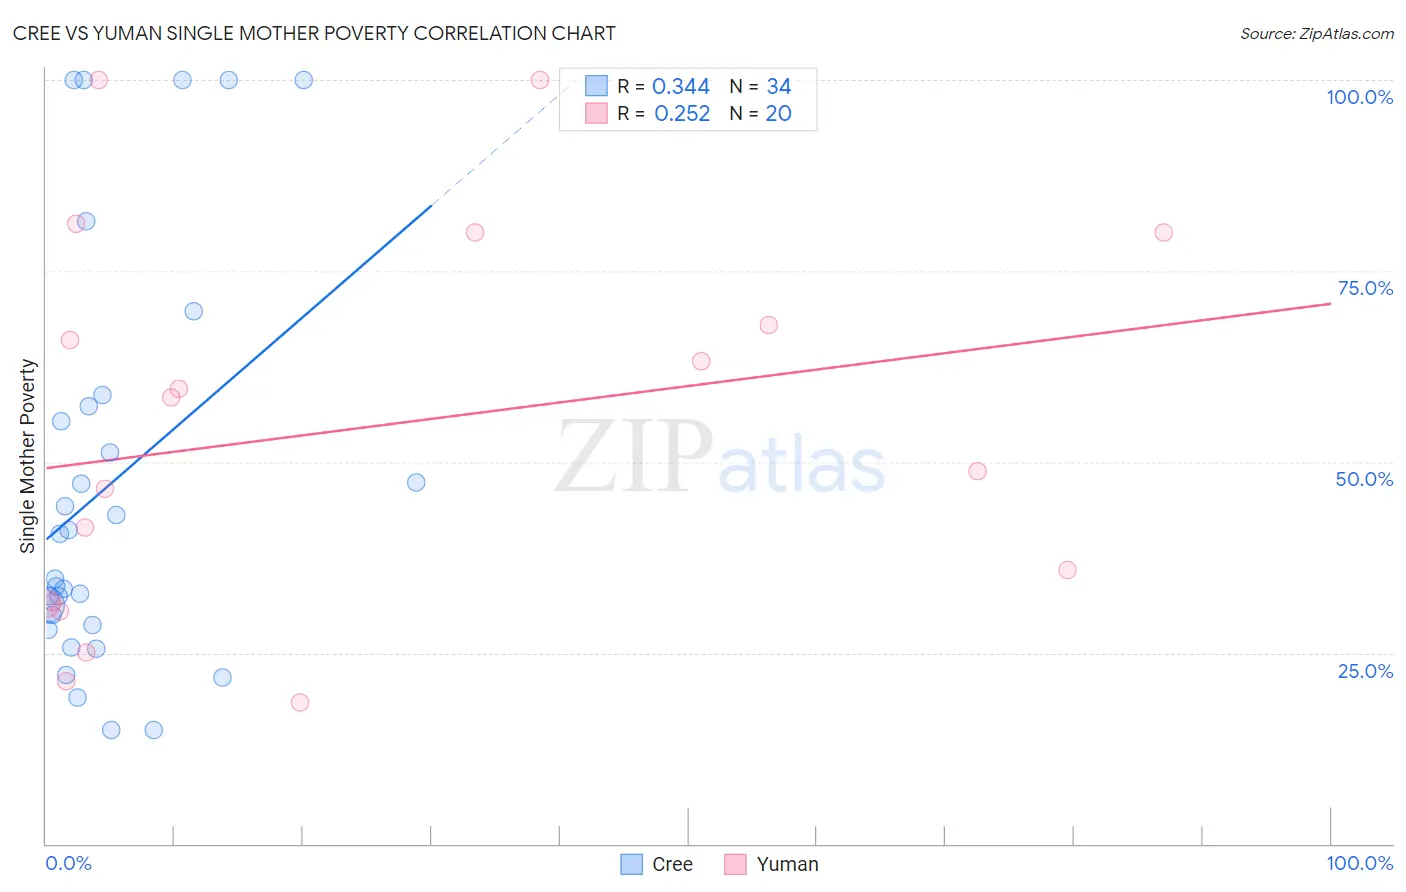
Cree vs Yuman Single Mother Poverty Correlation Chart
The statistical analysis conducted on geographies consisting of 75,775,779 people shows a mild positive correlation between the proportion of Cree and poverty level among single mothers in the United States with a correlation coefficient (R) of 0.344 and weighted average of 32.2%. Similarly, the statistical analysis conducted on geographies consisting of 40,528,655 people shows a weak positive correlation between the proportion of Yuman and poverty level among single mothers in the United States with a correlation coefficient (R) of 0.252 and weighted average of 37.8%, a difference of 17.4%.
Single Mother Poverty Correlation Summary
| Measurement | Cree | Yuman |
| Minimum | 14.9% | 18.5% |
| Maximum | 100.0% | 100.0% |
| Range | 85.1% | 81.5% |
| Mean | 47.0% | 54.4% |
| Median | 37.6% | 53.5% |
| Interquartile 25% (IQ1) | 28.6% | 31.5% |
| Interquartile 75% (IQ3) | 57.4% | 74.0% |
| Interquartile Range (IQR) | 28.8% | 42.5% |
| Standard Deviation (Sample) | 26.7% | 25.2% |
| Standard Deviation (Population) | 26.3% | 24.6% |
Similar Demographics by Single Mother Poverty
Demographics Similar to Cree by Single Mother Poverty
In terms of single mother poverty, the demographic groups most similar to Cree are Nonimmigrants (32.2%, a difference of 0.030%), Immigrants from the Azores (32.2%, a difference of 0.11%), Marshallese (32.1%, a difference of 0.24%), Spanish American (32.3%, a difference of 0.36%), and Immigrants from Zaire (32.0%, a difference of 0.64%).
| Demographics | Rating | Rank | Single Mother Poverty |
| Bangladeshis | 0.1 /100 | #274 | Tragic 31.7% |
| Central Americans | 0.1 /100 | #275 | Tragic 31.8% |
| Delaware | 0.0 /100 | #276 | Tragic 31.8% |
| Mexican American Indians | 0.0 /100 | #277 | Tragic 31.9% |
| Immigrants | Zaire | 0.0 /100 | #278 | Tragic 32.0% |
| Marshallese | 0.0 /100 | #279 | Tragic 32.1% |
| Immigrants | Nonimmigrants | 0.0 /100 | #280 | Tragic 32.2% |
| Cree | 0.0 /100 | #281 | Tragic 32.2% |
| Immigrants | Azores | 0.0 /100 | #282 | Tragic 32.2% |
| Spanish Americans | 0.0 /100 | #283 | Tragic 32.3% |
| Indonesians | 0.0 /100 | #284 | Tragic 32.4% |
| Immigrants | Latin America | 0.0 /100 | #285 | Tragic 32.4% |
| Yup'ik | 0.0 /100 | #286 | Tragic 32.5% |
| Immigrants | Dominica | 0.0 /100 | #287 | Tragic 32.5% |
| Somalis | 0.0 /100 | #288 | Tragic 32.6% |
Demographics Similar to Yuman by Single Mother Poverty
In terms of single mother poverty, the demographic groups most similar to Yuman are Pueblo (37.2%, a difference of 1.5%), Menominee (37.1%, a difference of 1.9%), Cheyenne (38.5%, a difference of 1.9%), Immigrants from Yemen (38.5%, a difference of 2.0%), and Pima (38.6%, a difference of 2.2%).
| Demographics | Rating | Rank | Single Mother Poverty |
| Choctaw | 0.0 /100 | #328 | Tragic 36.4% |
| Apache | 0.0 /100 | #329 | Tragic 36.6% |
| Natives/Alaskans | 0.0 /100 | #330 | Tragic 36.6% |
| Creek | 0.0 /100 | #331 | Tragic 36.7% |
| Dutch West Indians | 0.0 /100 | #332 | Tragic 36.8% |
| Menominee | 0.0 /100 | #333 | Tragic 37.1% |
| Pueblo | 0.0 /100 | #334 | Tragic 37.2% |
| Yuman | 0.0 /100 | #335 | Tragic 37.8% |
| Cheyenne | 0.0 /100 | #336 | Tragic 38.5% |
| Immigrants | Yemen | 0.0 /100 | #337 | Tragic 38.5% |
| Pima | 0.0 /100 | #338 | Tragic 38.6% |
| Crow | 0.0 /100 | #339 | Tragic 38.6% |
| Sioux | 0.0 /100 | #340 | Tragic 38.8% |
| Colville | 0.0 /100 | #341 | Tragic 39.3% |
| Navajo | 0.0 /100 | #342 | Tragic 40.2% |