Costa Rican vs Subsaharan African Female Poverty
COMPARE
Costa Rican
Subsaharan African
Female Poverty
Female Poverty Comparison
Costa Ricans
Sub-Saharan Africans
13.3%
FEMALE POVERTY
63.6/ 100
METRIC RATING
159th/ 347
METRIC RANK
15.8%
FEMALE POVERTY
0.1/ 100
METRIC RATING
267th/ 347
METRIC RANK
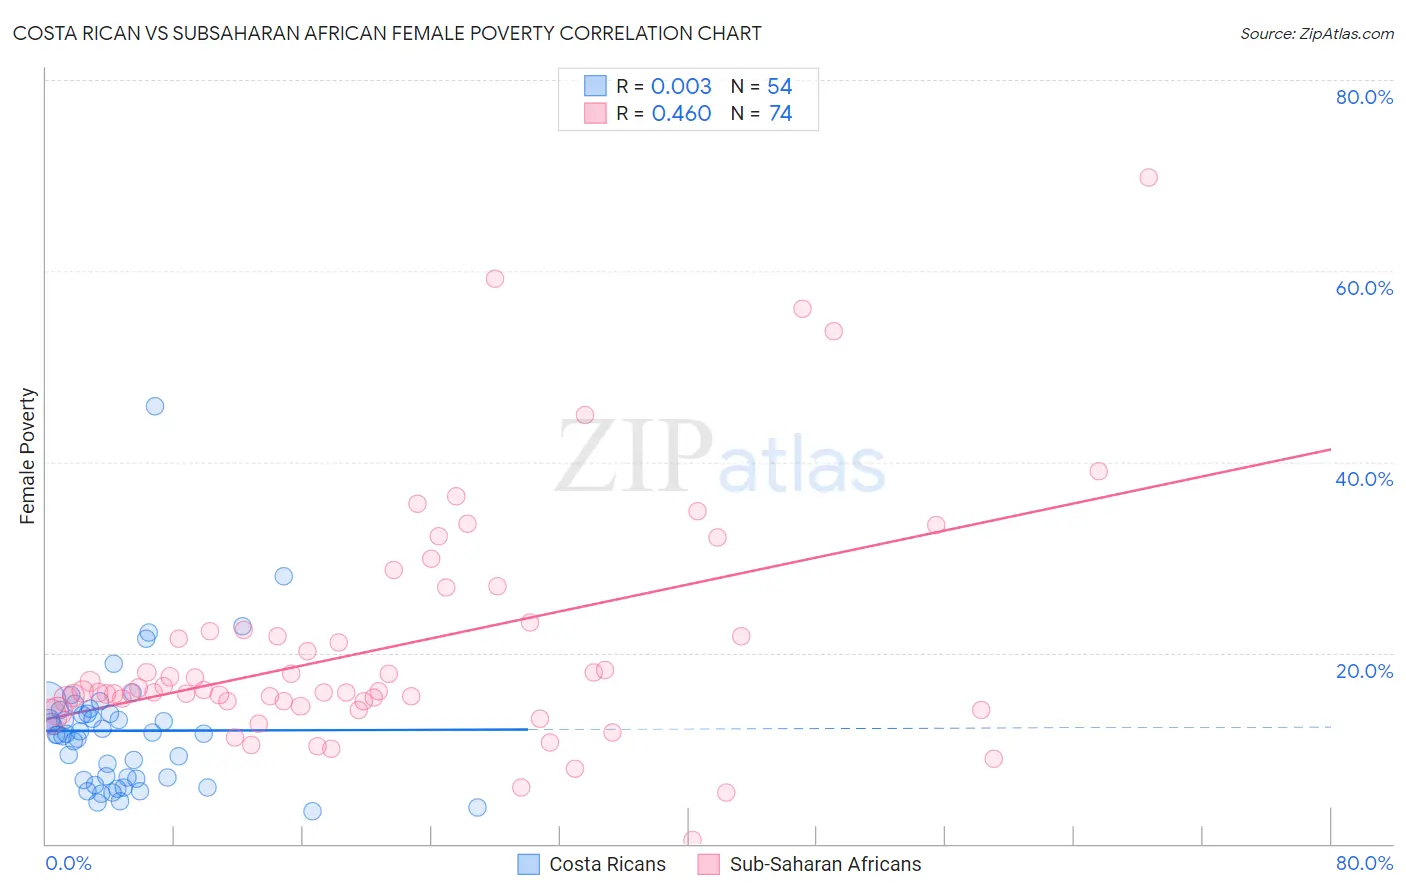
Costa Rican vs Subsaharan African Female Poverty Correlation Chart
The statistical analysis conducted on geographies consisting of 253,437,784 people shows no correlation between the proportion of Costa Ricans and poverty level among females in the United States with a correlation coefficient (R) of 0.003 and weighted average of 13.3%. Similarly, the statistical analysis conducted on geographies consisting of 507,469,907 people shows a moderate positive correlation between the proportion of Sub-Saharan Africans and poverty level among females in the United States with a correlation coefficient (R) of 0.460 and weighted average of 15.8%, a difference of 18.8%.
Female Poverty Correlation Summary
| Measurement | Costa Rican | Subsaharan African |
| Minimum | 3.4% | 0.38% |
| Maximum | 45.8% | 69.8% |
| Range | 42.4% | 69.4% |
| Mean | 11.8% | 20.8% |
| Median | 11.5% | 16.0% |
| Interquartile 25% (IQ1) | 6.8% | 14.9% |
| Interquartile 75% (IQ3) | 13.6% | 22.4% |
| Interquartile Range (IQR) | 6.8% | 7.5% |
| Standard Deviation (Sample) | 7.0% | 12.5% |
| Standard Deviation (Population) | 6.9% | 12.4% |
Similar Demographics by Female Poverty
Demographics Similar to Costa Ricans by Female Poverty
In terms of female poverty, the demographic groups most similar to Costa Ricans are Immigrants from Nepal (13.3%, a difference of 0.090%), Immigrants from Ethiopia (13.3%, a difference of 0.12%), Guamanian/Chamorro (13.3%, a difference of 0.12%), Immigrants from Albania (13.3%, a difference of 0.13%), and Ethiopian (13.3%, a difference of 0.14%).
| Demographics | Rating | Rank | Female Poverty |
| Samoans | 73.6 /100 | #152 | Good 13.1% |
| Immigrants | Fiji | 71.0 /100 | #153 | Good 13.2% |
| Armenians | 70.4 /100 | #154 | Good 13.2% |
| Hungarians | 70.1 /100 | #155 | Good 13.2% |
| Immigrants | Bosnia and Herzegovina | 69.7 /100 | #156 | Good 13.2% |
| Immigrants | Northern Africa | 68.8 /100 | #157 | Good 13.2% |
| Pennsylvania Germans | 67.3 /100 | #158 | Good 13.2% |
| Costa Ricans | 63.6 /100 | #159 | Good 13.3% |
| Immigrants | Nepal | 62.7 /100 | #160 | Good 13.3% |
| Immigrants | Ethiopia | 62.5 /100 | #161 | Good 13.3% |
| Guamanians/Chamorros | 62.4 /100 | #162 | Good 13.3% |
| Immigrants | Albania | 62.4 /100 | #163 | Good 13.3% |
| Ethiopians | 62.3 /100 | #164 | Good 13.3% |
| Scotch-Irish | 62.1 /100 | #165 | Good 13.3% |
| Immigrants | Oceania | 59.7 /100 | #166 | Average 13.3% |
Demographics Similar to Sub-Saharan Africans by Female Poverty
In terms of female poverty, the demographic groups most similar to Sub-Saharan Africans are Immigrants from Nicaragua (15.8%, a difference of 0.060%), Immigrants from El Salvador (15.7%, a difference of 0.43%), Iroquois (15.8%, a difference of 0.43%), Immigrants from Liberia (15.7%, a difference of 0.49%), and Chickasaw (15.9%, a difference of 0.69%).
| Demographics | Rating | Rank | Female Poverty |
| Immigrants | Guyana | 0.1 /100 | #260 | Tragic 15.6% |
| Guyanese | 0.1 /100 | #261 | Tragic 15.6% |
| Mexican American Indians | 0.1 /100 | #262 | Tragic 15.6% |
| Cherokee | 0.1 /100 | #263 | Tragic 15.6% |
| Immigrants | Ecuador | 0.1 /100 | #264 | Tragic 15.6% |
| Immigrants | Liberia | 0.1 /100 | #265 | Tragic 15.7% |
| Immigrants | El Salvador | 0.1 /100 | #266 | Tragic 15.7% |
| Sub-Saharan Africans | 0.1 /100 | #267 | Tragic 15.8% |
| Immigrants | Nicaragua | 0.1 /100 | #268 | Tragic 15.8% |
| Iroquois | 0.1 /100 | #269 | Tragic 15.8% |
| Chickasaw | 0.1 /100 | #270 | Tragic 15.9% |
| Immigrants | St. Vincent and the Grenadines | 0.0 /100 | #271 | Tragic 15.9% |
| Belizeans | 0.0 /100 | #272 | Tragic 15.9% |
| Haitians | 0.0 /100 | #273 | Tragic 15.9% |
| Barbadians | 0.0 /100 | #274 | Tragic 15.9% |