Colville vs Sri Lankan Seniors Poverty Over the Age of 75
COMPARE
Colville
Sri Lankan
Seniors Poverty Over the Age of 75
Seniors Poverty Over the Age of 75 Comparison
Colville
Sri Lankans
15.2%
SENIORS POVERTY OVER THE AGE OF 75
0.0/ 100
METRIC RATING
292nd/ 347
METRIC RANK
12.4%
SENIORS POVERTY OVER THE AGE OF 75
32.3/ 100
METRIC RATING
186th/ 347
METRIC RANK
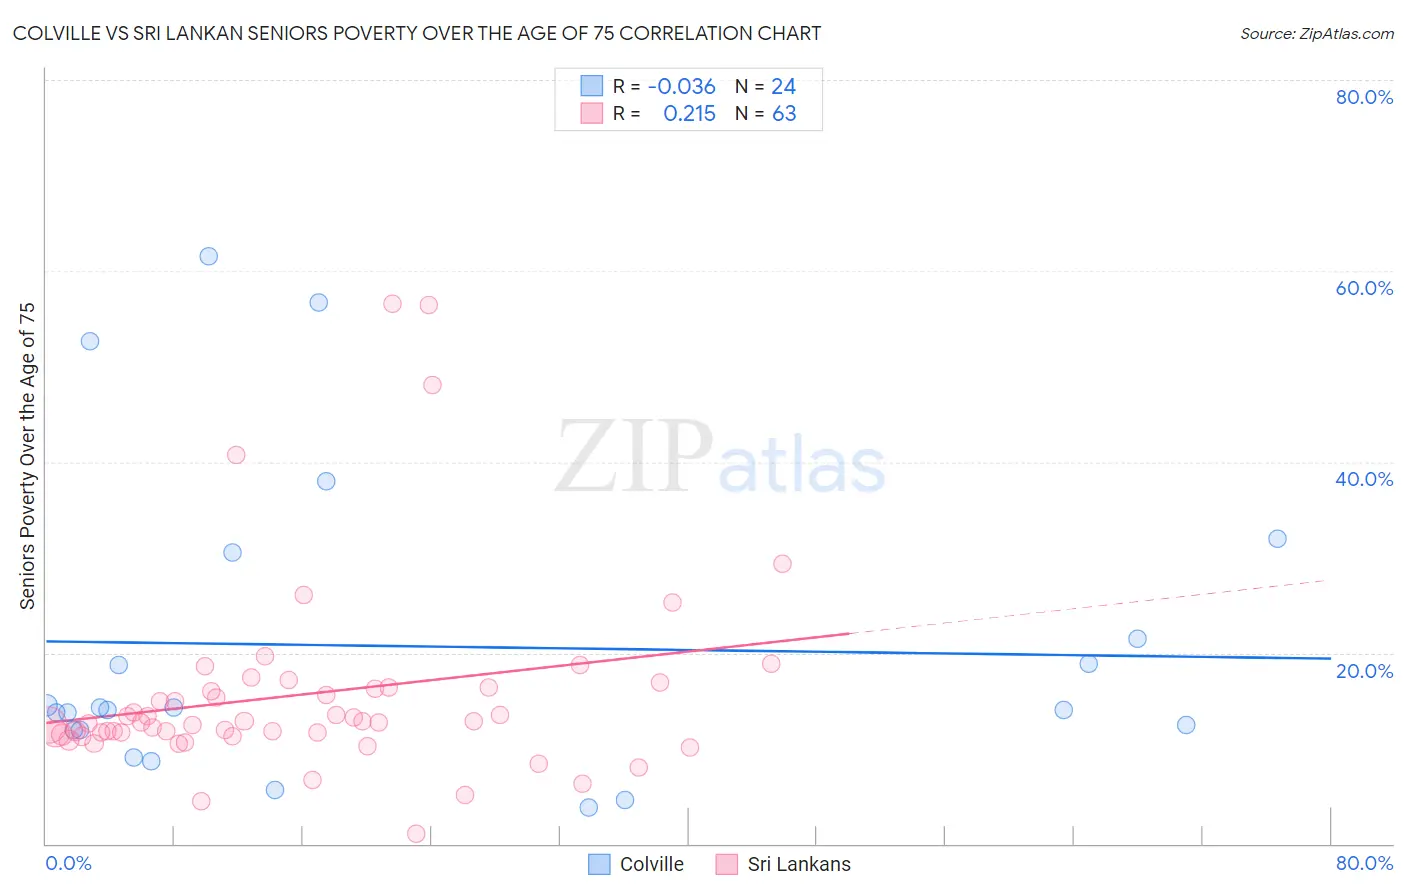
Colville vs Sri Lankan Seniors Poverty Over the Age of 75 Correlation Chart
The statistical analysis conducted on geographies consisting of 34,564,944 people shows no correlation between the proportion of Colville and poverty level among seniors over the age of 75 in the United States with a correlation coefficient (R) of -0.036 and weighted average of 15.2%. Similarly, the statistical analysis conducted on geographies consisting of 434,587,181 people shows a weak positive correlation between the proportion of Sri Lankans and poverty level among seniors over the age of 75 in the United States with a correlation coefficient (R) of 0.215 and weighted average of 12.4%, a difference of 23.0%.
Seniors Poverty Over the Age of 75 Correlation Summary
| Measurement | Colville | Sri Lankan |
| Minimum | 3.7% | 1.0% |
| Maximum | 61.5% | 56.5% |
| Range | 57.8% | 55.5% |
| Mean | 20.7% | 15.6% |
| Median | 14.1% | 12.7% |
| Interquartile 25% (IQ1) | 11.9% | 11.4% |
| Interquartile 75% (IQ3) | 26.0% | 16.4% |
| Interquartile Range (IQR) | 14.1% | 5.0% |
| Standard Deviation (Sample) | 16.3% | 10.4% |
| Standard Deviation (Population) | 15.9% | 10.3% |
Similar Demographics by Seniors Poverty Over the Age of 75
Demographics Similar to Colville by Seniors Poverty Over the Age of 75
In terms of seniors poverty over the age of 75, the demographic groups most similar to Colville are Paiute (15.2%, a difference of 0.18%), Immigrants from the Azores (15.2%, a difference of 0.20%), Immigrants from Belize (15.2%, a difference of 0.22%), Apache (15.3%, a difference of 0.40%), and Jamaican (15.1%, a difference of 0.48%).
| Demographics | Rating | Rank | Seniors Poverty Over the Age of 75 |
| Immigrants | Mexico | 0.0 /100 | #285 | Tragic 14.9% |
| Immigrants | Central America | 0.0 /100 | #286 | Tragic 15.0% |
| Immigrants | Guatemala | 0.0 /100 | #287 | Tragic 15.1% |
| Jamaicans | 0.0 /100 | #288 | Tragic 15.1% |
| Immigrants | Belize | 0.0 /100 | #289 | Tragic 15.2% |
| Immigrants | Azores | 0.0 /100 | #290 | Tragic 15.2% |
| Paiute | 0.0 /100 | #291 | Tragic 15.2% |
| Colville | 0.0 /100 | #292 | Tragic 15.2% |
| Apache | 0.0 /100 | #293 | Tragic 15.3% |
| Immigrants | Jamaica | 0.0 /100 | #294 | Tragic 15.3% |
| U.S. Virgin Islanders | 0.0 /100 | #295 | Tragic 15.4% |
| Yuman | 0.0 /100 | #296 | Tragic 15.4% |
| Hondurans | 0.0 /100 | #297 | Tragic 15.4% |
| Natives/Alaskans | 0.0 /100 | #298 | Tragic 15.5% |
| Spanish American Indians | 0.0 /100 | #299 | Tragic 15.5% |
Demographics Similar to Sri Lankans by Seniors Poverty Over the Age of 75
In terms of seniors poverty over the age of 75, the demographic groups most similar to Sri Lankans are Immigrants from Malaysia (12.3%, a difference of 0.31%), Kiowa (12.3%, a difference of 0.32%), Laotian (12.3%, a difference of 0.52%), Yaqui (12.5%, a difference of 0.63%), and Immigrants from Northern Africa (12.5%, a difference of 0.70%).
| Demographics | Rating | Rank | Seniors Poverty Over the Age of 75 |
| Mongolians | 45.5 /100 | #179 | Average 12.2% |
| Immigrants | South Eastern Asia | 44.3 /100 | #180 | Average 12.2% |
| Immigrants | Australia | 44.2 /100 | #181 | Average 12.2% |
| German Russians | 41.4 /100 | #182 | Average 12.3% |
| Laotians | 38.2 /100 | #183 | Fair 12.3% |
| Kiowa | 36.0 /100 | #184 | Fair 12.3% |
| Immigrants | Malaysia | 35.8 /100 | #185 | Fair 12.3% |
| Sri Lankans | 32.3 /100 | #186 | Fair 12.4% |
| Yaqui | 25.9 /100 | #187 | Fair 12.5% |
| Immigrants | Northern Africa | 25.2 /100 | #188 | Fair 12.5% |
| Immigrants | Indonesia | 24.4 /100 | #189 | Fair 12.5% |
| Immigrants | Congo | 23.9 /100 | #190 | Fair 12.5% |
| Liberians | 23.2 /100 | #191 | Fair 12.5% |
| Choctaw | 20.2 /100 | #192 | Fair 12.5% |
| Taiwanese | 17.8 /100 | #193 | Poor 12.6% |