Colombian vs Mexican American Indian Poverty
COMPARE
Colombian
Mexican American Indian
Poverty
Poverty Comparison
Colombians
Mexican American Indians
12.2%
POVERTY
57.8/ 100
METRIC RATING
164th/ 347
METRIC RANK
14.3%
POVERTY
0.1/ 100
METRIC RATING
256th/ 347
METRIC RANK
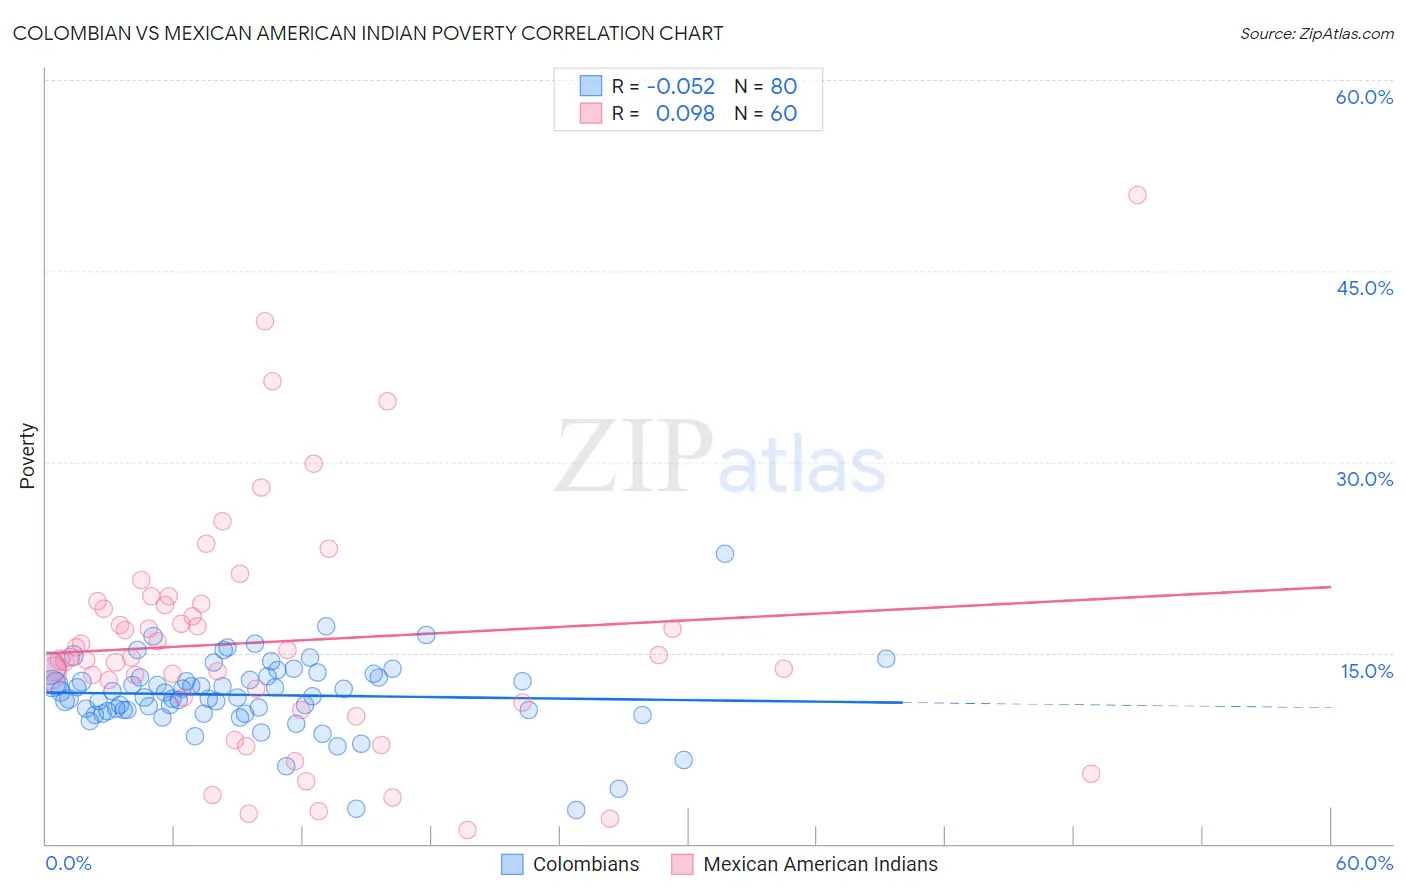
Colombian vs Mexican American Indian Poverty Correlation Chart
The statistical analysis conducted on geographies consisting of 419,330,126 people shows a slight negative correlation between the proportion of Colombians and poverty level in the United States with a correlation coefficient (R) of -0.052 and weighted average of 12.2%. Similarly, the statistical analysis conducted on geographies consisting of 317,505,642 people shows a slight positive correlation between the proportion of Mexican American Indians and poverty level in the United States with a correlation coefficient (R) of 0.098 and weighted average of 14.3%, a difference of 16.9%.
Poverty Correlation Summary
| Measurement | Colombian | Mexican American Indian |
| Minimum | 2.6% | 1.1% |
| Maximum | 22.8% | 51.0% |
| Range | 20.2% | 49.9% |
| Mean | 11.7% | 15.9% |
| Median | 11.7% | 14.6% |
| Interquartile 25% (IQ1) | 10.5% | 11.3% |
| Interquartile 75% (IQ3) | 13.1% | 18.8% |
| Interquartile Range (IQR) | 2.7% | 7.5% |
| Standard Deviation (Sample) | 3.0% | 9.3% |
| Standard Deviation (Population) | 3.0% | 9.2% |
Similar Demographics by Poverty
Demographics Similar to Colombians by Poverty
In terms of poverty, the demographic groups most similar to Colombians are Immigrants from Albania (12.2%, a difference of 0.010%), Immigrants from Ethiopia (12.2%, a difference of 0.070%), Venezuelan (12.2%, a difference of 0.10%), Immigrants from Chile (12.2%, a difference of 0.11%), and Ethiopian (12.2%, a difference of 0.12%).
| Demographics | Rating | Rank | Poverty |
| Costa Ricans | 62.2 /100 | #157 | Good 12.2% |
| Taiwanese | 61.8 /100 | #158 | Good 12.2% |
| Pennsylvania Germans | 60.8 /100 | #159 | Good 12.2% |
| Immigrants | Nepal | 60.4 /100 | #160 | Good 12.2% |
| Immigrants | Fiji | 59.1 /100 | #161 | Average 12.2% |
| Ethiopians | 59.1 /100 | #162 | Average 12.2% |
| Immigrants | Ethiopia | 58.6 /100 | #163 | Average 12.2% |
| Colombians | 57.8 /100 | #164 | Average 12.2% |
| Immigrants | Albania | 57.7 /100 | #165 | Average 12.2% |
| Venezuelans | 56.9 /100 | #166 | Average 12.2% |
| Immigrants | Chile | 56.7 /100 | #167 | Average 12.2% |
| Immigrants | Venezuela | 56.5 /100 | #168 | Average 12.2% |
| Whites/Caucasians | 55.4 /100 | #169 | Average 12.3% |
| Immigrants | Oceania | 54.6 /100 | #170 | Average 12.3% |
| Immigrants | Spain | 51.3 /100 | #171 | Average 12.3% |
Demographics Similar to Mexican American Indians by Poverty
In terms of poverty, the demographic groups most similar to Mexican American Indians are Immigrants from Ecuador (14.3%, a difference of 0.020%), Trinidadian and Tobagonian (14.3%, a difference of 0.040%), Ottawa (14.3%, a difference of 0.050%), Immigrants from El Salvador (14.3%, a difference of 0.11%), and Immigrants from Nicaragua (14.3%, a difference of 0.32%).
| Demographics | Rating | Rank | Poverty |
| Immigrants | Ghana | 0.2 /100 | #249 | Tragic 14.2% |
| Cree | 0.2 /100 | #250 | Tragic 14.2% |
| Immigrants | Burma/Myanmar | 0.2 /100 | #251 | Tragic 14.2% |
| Spanish American Indians | 0.2 /100 | #252 | Tragic 14.2% |
| Immigrants | Trinidad and Tobago | 0.2 /100 | #253 | Tragic 14.2% |
| Immigrants | El Salvador | 0.1 /100 | #254 | Tragic 14.3% |
| Immigrants | Ecuador | 0.1 /100 | #255 | Tragic 14.3% |
| Mexican American Indians | 0.1 /100 | #256 | Tragic 14.3% |
| Trinidadians and Tobagonians | 0.1 /100 | #257 | Tragic 14.3% |
| Ottawa | 0.1 /100 | #258 | Tragic 14.3% |
| Immigrants | Nicaragua | 0.1 /100 | #259 | Tragic 14.3% |
| Cape Verdeans | 0.1 /100 | #260 | Tragic 14.4% |
| Cherokee | 0.1 /100 | #261 | Tragic 14.4% |
| Immigrants | Liberia | 0.1 /100 | #262 | Tragic 14.4% |
| Jamaicans | 0.1 /100 | #263 | Tragic 14.4% |