Colombian vs Immigrants from Dominica Child Poverty Among Boys Under 16
COMPARE
Colombian
Immigrants from Dominica
Child Poverty Among Boys Under 16
Child Poverty Among Boys Under 16 Comparison
Colombians
Immigrants from Dominica
16.1%
CHILD POVERTY AMONG BOYS UNDER 16
65.2/ 100
METRIC RATING
165th/ 347
METRIC RANK
22.2%
CHILD POVERTY AMONG BOYS UNDER 16
0.0/ 100
METRIC RATING
322nd/ 347
METRIC RANK
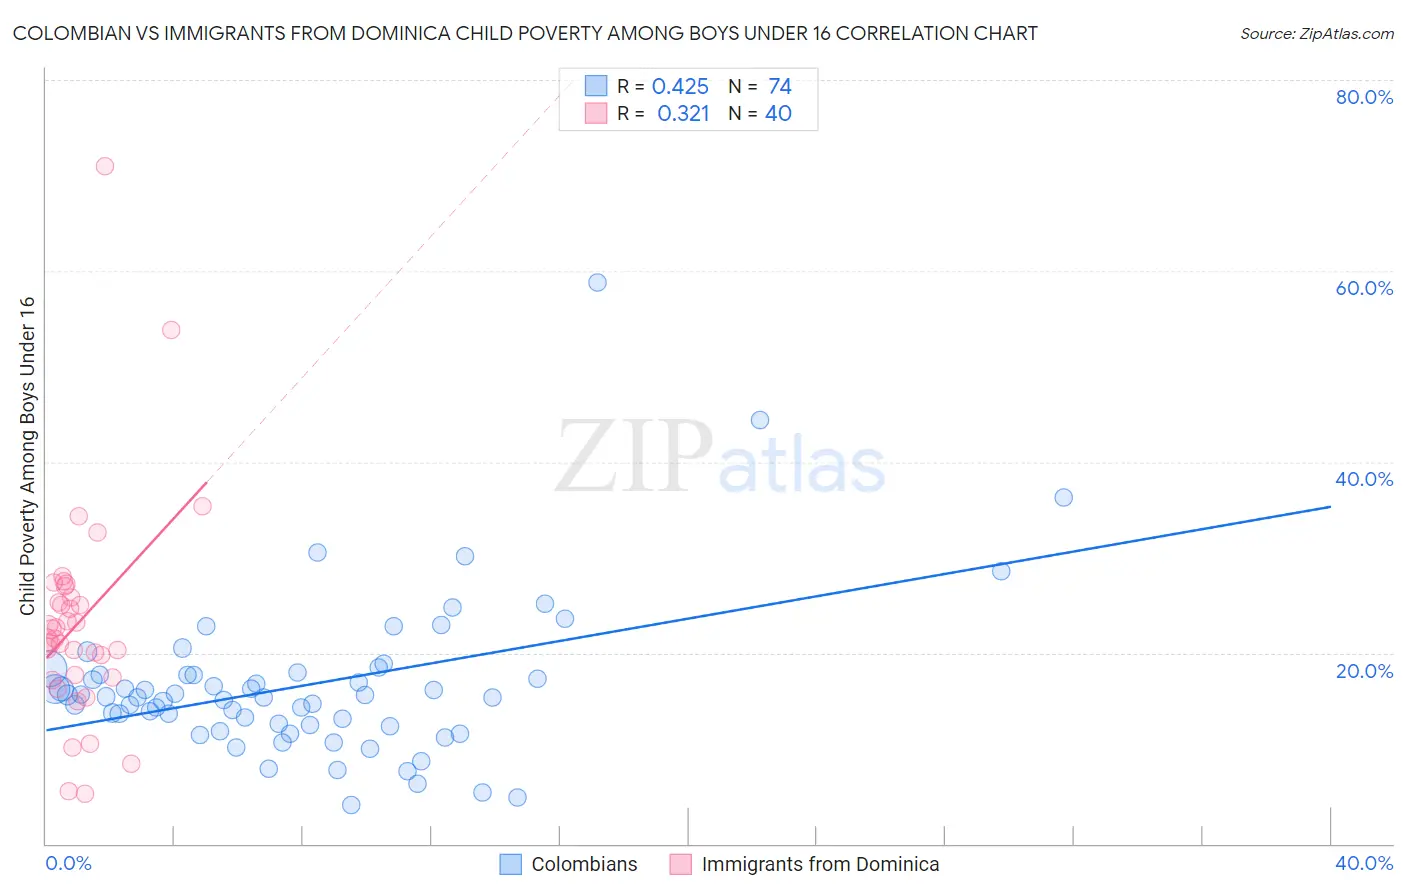
Colombian vs Immigrants from Dominica Child Poverty Among Boys Under 16 Correlation Chart
The statistical analysis conducted on geographies consisting of 412,508,797 people shows a moderate positive correlation between the proportion of Colombians and poverty level among boys under the age of 16 in the United States with a correlation coefficient (R) of 0.425 and weighted average of 16.1%. Similarly, the statistical analysis conducted on geographies consisting of 83,576,138 people shows a mild positive correlation between the proportion of Immigrants from Dominica and poverty level among boys under the age of 16 in the United States with a correlation coefficient (R) of 0.321 and weighted average of 22.2%, a difference of 37.5%.
Child Poverty Among Boys Under 16 Correlation Summary
| Measurement | Colombian | Immigrants from Dominica |
| Minimum | 4.0% | 5.2% |
| Maximum | 58.8% | 70.9% |
| Range | 54.7% | 65.7% |
| Mean | 16.6% | 23.2% |
| Median | 15.4% | 22.0% |
| Interquartile 25% (IQ1) | 12.4% | 17.6% |
| Interquartile 75% (IQ3) | 17.7% | 26.4% |
| Interquartile Range (IQR) | 5.3% | 8.8% |
| Standard Deviation (Sample) | 8.3% | 11.6% |
| Standard Deviation (Population) | 8.3% | 11.4% |
Similar Demographics by Child Poverty Among Boys Under 16
Demographics Similar to Colombians by Child Poverty Among Boys Under 16
In terms of child poverty among boys under 16, the demographic groups most similar to Colombians are Immigrants from Germany (16.2%, a difference of 0.20%), Immigrants from Albania (16.1%, a difference of 0.35%), Costa Rican (16.1%, a difference of 0.38%), Guamanian/Chamorro (16.1%, a difference of 0.58%), and Immigrants from Oceania (16.0%, a difference of 0.81%).
| Demographics | Rating | Rank | Child Poverty Among Boys Under 16 |
| Yugoslavians | 75.9 /100 | #158 | Good 15.9% |
| Immigrants | Chile | 74.8 /100 | #159 | Good 15.9% |
| Immigrants | Northern Africa | 71.3 /100 | #160 | Good 16.0% |
| Immigrants | Oceania | 71.3 /100 | #161 | Good 16.0% |
| Guamanians/Chamorros | 69.6 /100 | #162 | Good 16.1% |
| Costa Ricans | 68.1 /100 | #163 | Good 16.1% |
| Immigrants | Albania | 67.9 /100 | #164 | Good 16.1% |
| Colombians | 65.2 /100 | #165 | Good 16.1% |
| Immigrants | Germany | 63.6 /100 | #166 | Good 16.2% |
| Afghans | 55.4 /100 | #167 | Average 16.3% |
| South Americans | 55.3 /100 | #168 | Average 16.3% |
| Immigrants | Saudi Arabia | 53.6 /100 | #169 | Average 16.4% |
| Immigrants | Bosnia and Herzegovina | 51.7 /100 | #170 | Average 16.4% |
| Immigrants | Ethiopia | 51.3 /100 | #171 | Average 16.4% |
| Immigrants | Colombia | 50.8 /100 | #172 | Average 16.4% |
Demographics Similar to Immigrants from Dominica by Child Poverty Among Boys Under 16
In terms of child poverty among boys under 16, the demographic groups most similar to Immigrants from Dominica are Cajun (22.2%, a difference of 0.020%), Honduran (22.3%, a difference of 0.53%), Immigrants from Congo (22.4%, a difference of 0.91%), U.S. Virgin Islander (22.0%, a difference of 0.93%), and Central American Indian (22.5%, a difference of 1.4%).
| Demographics | Rating | Rank | Child Poverty Among Boys Under 16 |
| Immigrants | Somalia | 0.0 /100 | #315 | Tragic 21.7% |
| Menominee | 0.0 /100 | #316 | Tragic 21.7% |
| Africans | 0.0 /100 | #317 | Tragic 21.7% |
| Yakama | 0.0 /100 | #318 | Tragic 21.7% |
| Dutch West Indians | 0.0 /100 | #319 | Tragic 21.8% |
| U.S. Virgin Islanders | 0.0 /100 | #320 | Tragic 22.0% |
| Cajuns | 0.0 /100 | #321 | Tragic 22.2% |
| Immigrants | Dominica | 0.0 /100 | #322 | Tragic 22.2% |
| Hondurans | 0.0 /100 | #323 | Tragic 22.3% |
| Immigrants | Congo | 0.0 /100 | #324 | Tragic 22.4% |
| Central American Indians | 0.0 /100 | #325 | Tragic 22.5% |
| Paiute | 0.0 /100 | #326 | Tragic 22.8% |
| Immigrants | Honduras | 0.0 /100 | #327 | Tragic 22.8% |
| Pueblo | 0.0 /100 | #328 | Tragic 23.5% |
| Natives/Alaskans | 0.0 /100 | #329 | Tragic 24.0% |