Colombian vs Asian Child Poverty Among Boys Under 16

COMPARE

Colombian
Race
Ancestry
AfghanAfricanAlaska NativeAlaskan AthabascanAlbanianAleutAlsatianAmericanApacheArabArapahoArgentineanArmenianAssyrian/Chaldean/SyriacAustralianAustrianBahamianBangladeshiBarbadianBasqueBelgianBelizeanBermudanBhutaneseBlackfeetBolivianBrazilianBritishBritish West IndianBulgarianBurmeseCajunCambodianCanadianCape VerdeanCarpatho RusynCelticCentral AmericanCentral American IndianCherokeeCheyenneChickasawChileanChineseChippewaChoctawColombianColvilleComancheCosta RicanCreeCreekCroatianCrowCubanCypriotCzechCzechoslovakianDanishDelawareDominicanDutchDutch West IndianEastern EuropeanEcuadorianEgyptianEnglishEstonianEthiopianEuropeanFijianFilipinoFinnishFrenchFrench American IndianFrench CanadianGermanGerman RussianGhanaianGreekGuamanian/ChamorroGuatemalanGuyaneseHaitianHmongHonduranHopiHoumaHungarianIcelanderIndian (Asian)IndonesianInupiatIranianIraqiIrishIroquoisIsraeliItalianJamaicanJapaneseJordanianKenyanKiowaKoreanLaotianLatvianLebaneseLiberianLithuanianLumbeeLuxembourgerMacedonianMalaysianMalteseMarshalleseMenomineeMexicanMexican American IndianMongolianMoroccanNative HawaiianNavajoNepaleseNew ZealanderNicaraguanNigerianNorthern EuropeanNorwegianOkinawanOsageOttawaPaiutePakistaniPalestinianPanamanianParaguayanPennsylvania GermanPeruvianPimaPolishPortuguesePotawatomiPuebloPuerto RicanPuget Sound SalishRomanianRussianSalvadoranSamoanScandinavianScotch-IrishScottishSeminoleSenegaleseSerbianShoshoneSierra LeoneanSiouxSlavicSlovakSloveneSomaliSouth AfricanSouth AmericanSouth American IndianSoviet UnionSpaniardSpanishSpanish AmericanSpanish American IndianSri LankanSubsaharan AfricanSudaneseSwedishSwissSyrianTaiwaneseThaiTlingit-HaidaTohono O'OdhamTonganTrinidadian and TobagonianTsimshianTurkishU.S. Virgin IslanderUgandanUkrainianUruguayanUteVenezuelanVietnameseWelshWest IndianYakamaYaquiYugoslavianYumanYup'ikZimbabwean
Immigration
NonimmigrantsImmigrantsAfghanistanAfricaAlbaniaArgentinaArmeniaAsiaAustraliaAustriaBahamasBangladeshBarbadosBelarusBelgiumBelizeBoliviaBosnia and HerzegovinaBrazilBulgariaBurma/MyanmarCabo VerdeCambodiaCameroonCanadaCaribbeanCentral AmericaChileChinaColombiaCongoCosta RicaCroatiaCubaCzechoslovakiaDenmarkDominicaDominican RepublicEastern AfricaEastern AsiaEastern EuropeEcuadorEgyptEl SalvadorEnglandEritreaEthiopiaEuropeFijiFranceGermanyGhanaGreeceGrenadaGuatemalaGuyanaHaitiHondurasHong KongHungaryIndiaIndonesiaIranIraqIrelandIsraelItalyJamaicaJapanJordanKazakhstanKenyaKoreaKuwaitLaosLatin AmericaLatviaLebanonLiberiaLithuaniaMalaysiaMexicoMicronesiaMiddle AfricaMoldovaMoroccoNepalNetherlandsNicaraguaNigeriaNorth AmericaNorth MacedoniaNorthern AfricaNorthern EuropeNorwayOceaniaPakistanPanamaPeruPhilippinesPolandPortugalRomaniaRussiaSaudi ArabiaScotlandSenegalSerbiaSierra LeoneSingaporeSomaliaSouth AfricaSouth AmericaSouth Central AsiaSouth Eastern AsiaSouthern EuropeSpainSri LankaSt. Vincent and the GrenadinesSudanSwedenSwitzerlandSyriaTaiwanThailandTrinidad and TobagoTurkeyUgandaUkraineUruguayUzbekistanVenezuelaVietnamWest IndiesWestern AfricaWestern AsiaWestern EuropeYemenZaireZimbabweAzores
Asian
Race
Ancestry
AfghanAfricanAlaska NativeAlaskan AthabascanAlbanianAleutAlsatianAmericanApacheArabArapahoArgentineanArmenianAssyrian/Chaldean/SyriacAustralianAustrianBahamianBangladeshiBarbadianBasqueBelgianBelizeanBermudanBhutaneseBlackfeetBolivianBrazilianBritishBritish West IndianBulgarianBurmeseCajunCambodianCanadianCape VerdeanCarpatho RusynCelticCentral AmericanCentral American IndianCherokeeCheyenneChickasawChileanChineseChippewaChoctawColvilleComancheCosta RicanCreeCreekCroatianCrowCubanCypriotCzechCzechoslovakianDanishDelawareDominicanDutchDutch West IndianEastern EuropeanEcuadorianEgyptianEnglishEstonianEthiopianEuropeanFijianFilipinoFinnishFrenchFrench American IndianFrench CanadianGermanGerman RussianGhanaianGreekGuamanian/ChamorroGuatemalanGuyaneseHaitianHmongHonduranHopiHoumaHungarianIcelanderIndian (Asian)IndonesianInupiatIranianIraqiIrishIroquoisIsraeliItalianJamaicanJapaneseJordanianKenyanKiowaKoreanLaotianLatvianLebaneseLiberianLithuanianLumbeeLuxembourgerMacedonianMalaysianMalteseMarshalleseMenomineeMexicanMexican American IndianMongolianMoroccanNative HawaiianNavajoNepaleseNew ZealanderNicaraguanNigerianNorthern EuropeanNorwegianOkinawanOsageOttawaPaiutePakistaniPalestinianPanamanianParaguayanPennsylvania GermanPeruvianPimaPolishPortuguesePotawatomiPuebloPuerto RicanPuget Sound SalishRomanianRussianSalvadoranSamoanScandinavianScotch-IrishScottishSeminoleSenegaleseSerbianShoshoneSierra LeoneanSiouxSlavicSlovakSloveneSomaliSouth AfricanSouth AmericanSouth American IndianSoviet UnionSpaniardSpanishSpanish AmericanSpanish American IndianSri LankanSubsaharan AfricanSudaneseSwedishSwissSyrianTaiwaneseThaiTlingit-HaidaTohono O'OdhamTonganTrinidadian and TobagonianTsimshianTurkishU.S. Virgin IslanderUgandanUkrainianUruguayanUteVenezuelanVietnameseWelshWest IndianYakamaYaquiYugoslavianYumanYup'ikZimbabwean
Immigration
NonimmigrantsImmigrantsAfghanistanAfricaAlbaniaArgentinaArmeniaAsiaAustraliaAustriaBahamasBangladeshBarbadosBelarusBelgiumBelizeBoliviaBosnia and HerzegovinaBrazilBulgariaBurma/MyanmarCabo VerdeCambodiaCameroonCanadaCaribbeanCentral AmericaChileChinaColombiaCongoCosta RicaCroatiaCubaCzechoslovakiaDenmarkDominicaDominican RepublicEastern AfricaEastern AsiaEastern EuropeEcuadorEgyptEl SalvadorEnglandEritreaEthiopiaEuropeFijiFranceGermanyGhanaGreeceGrenadaGuatemalaGuyanaHaitiHondurasHong KongHungaryIndiaIndonesiaIranIraqIrelandIsraelItalyJamaicaJapanJordanKazakhstanKenyaKoreaKuwaitLaosLatin AmericaLatviaLebanonLiberiaLithuaniaMalaysiaMexicoMicronesiaMiddle AfricaMoldovaMoroccoNepalNetherlandsNicaraguaNigeriaNorth AmericaNorth MacedoniaNorthern AfricaNorthern EuropeNorwayOceaniaPakistanPanamaPeruPhilippinesPolandPortugalRomaniaRussiaSaudi ArabiaScotlandSenegalSerbiaSierra LeoneSingaporeSomaliaSouth AfricaSouth AmericaSouth Central AsiaSouth Eastern AsiaSouthern EuropeSpainSri LankaSt. Vincent and the GrenadinesSudanSwedenSwitzerlandSyriaTaiwanThailandTrinidad and TobagoTurkeyUgandaUkraineUruguayUzbekistanVenezuelaVietnamWest IndiesWestern AfricaWestern AsiaWestern EuropeYemenZaireZimbabweAzores
Child Poverty Among Boys Under 16
Income
Poverty
Unemployment
Labor Participation
Family Structure
Vehicle Availability
Education Level
Disability

Child Poverty Among Boys Under 16 Comparison

Colombians

Asians

Good
Exceptional
16.1%
CHILD POVERTY AMONG BOYS UNDER 16
65.2/ 100
METRIC RATING
165th/ 347
METRIC RANK
13.5%
CHILD POVERTY AMONG BOYS UNDER 16
99.8/ 100
METRIC RATING
27th/ 347
METRIC RANK

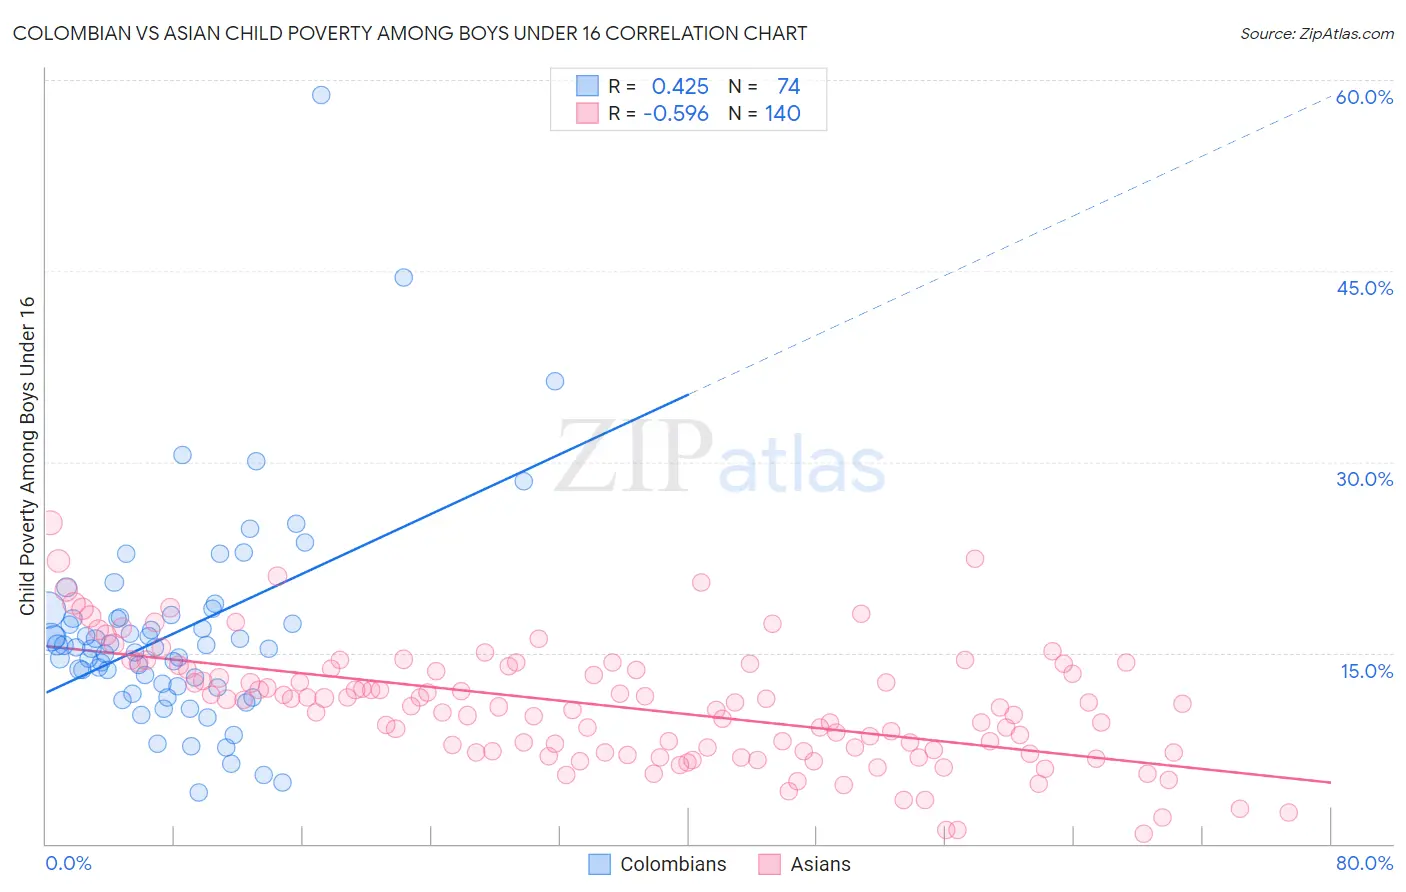
Colombian vs Asian Child Poverty Among Boys Under 16 Correlation Chart

The statistical analysis conducted on geographies consisting of 412,508,797 people shows a moderate positive correlation between the proportion of Colombians and poverty level among boys under the age of 16 in the United States with a correlation coefficient (R) of 0.425 and weighted average of 16.1%. Similarly, the statistical analysis conducted on geographies consisting of 533,622,634 people shows a substantial negative correlation between the proportion of Asians and poverty level among boys under the age of 16 in the United States with a correlation coefficient (R) of -0.596 and weighted average of 13.5%, a difference of 19.4%.
Colombian vs Asian Child Poverty Among Boys Under 16

Child Poverty Among Boys Under 16 Correlation Summary

MeasurementColombianAsian
Minimum4.0%0.83%
Maximum58.8%25.2%
Range54.7%24.4%
Mean16.6%10.8%
Median15.4%10.9%
Interquartile 25% (IQ1)12.4%7.2%
Interquartile 75% (IQ3)17.7%13.8%
Interquartile Range (IQR)5.3%6.6%
Standard Deviation (Sample)8.3%4.6%
Standard Deviation (Population)8.3%4.6%

Similar Demographics by Child Poverty Among Boys Under 16

Demographics Similar to Colombians by Child Poverty Among Boys Under 16

In terms of child poverty among boys under 16, the demographic groups most similar to Colombians are Immigrants from Germany (16.2%, a difference of 0.20%), Immigrants from Albania (16.1%, a difference of 0.35%), Costa Rican (16.1%, a difference of 0.38%), Guamanian/Chamorro (16.1%, a difference of 0.58%), and Immigrants from Oceania (16.0%, a difference of 0.81%).
DemographicsRating | RankChild Poverty Among Boys Under 16
Yugoslavians
75.9
/100
|
#158
Good
15.9%
Immigrants | Chile
74.8
/100
|
#159
Good
15.9%
Immigrants | Northern Africa
71.3
/100
|
#160
Good
16.0%
Immigrants | Oceania
71.3
/100
|
#161
Good
16.0%
Guamanians/Chamorros
69.6
/100
|
#162
Good
16.1%
Costa Ricans
68.1
/100
|
#163
Good
16.1%
Immigrants | Albania
67.9
/100
|
#164
Good
16.1%
Colombians
65.2
/100
|
#165
Good
16.1%
Immigrants | Germany
63.6
/100
|
#166
Good
16.2%
Afghans
55.4
/100
|
#167
Average
16.3%
South Americans
55.3
/100
|
#168
Average
16.3%
Immigrants | Saudi Arabia
53.6
/100
|
#169
Average
16.4%
Immigrants | Bosnia and Herzegovina
51.7
/100
|
#170
Average
16.4%
Immigrants | Ethiopia
51.3
/100
|
#171
Average
16.4%
Immigrants | Colombia
50.8
/100
|
#172
Average
16.4%

Demographics Similar to Asians by Child Poverty Among Boys Under 16

In terms of child poverty among boys under 16, the demographic groups most similar to Asians are Eastern European (13.5%, a difference of 0.060%), Immigrants from Bolivia (13.5%, a difference of 0.080%), Okinawan (13.5%, a difference of 0.17%), Cypriot (13.6%, a difference of 0.26%), and Immigrants from Lithuania (13.5%, a difference of 0.29%).
DemographicsRating | RankChild Poverty Among Boys Under 16
Indians (Asian)
99.9
/100
|
#20
Exceptional
13.3%
Immigrants | Eastern Asia
99.9
/100
|
#21
Exceptional
13.3%
Tongans
99.9
/100
|
#22
Exceptional
13.4%
Latvians
99.9
/100
|
#23
Exceptional
13.4%
Immigrants | Lithuania
99.8
/100
|
#24
Exceptional
13.5%
Okinawans
99.8
/100
|
#25
Exceptional
13.5%
Immigrants | Bolivia
99.8
/100
|
#26
Exceptional
13.5%
Asians
99.8
/100
|
#27
Exceptional
13.5%
Eastern Europeans
99.8
/100
|
#28
Exceptional
13.5%
Cypriots
99.8
/100
|
#29
Exceptional
13.6%
Swedes
99.8
/100
|
#30
Exceptional
13.6%
Turks
99.8
/100
|
#31
Exceptional
13.6%
Immigrants | China
99.8
/100
|
#32
Exceptional
13.6%
Danes
99.8
/100
|
#33
Exceptional
13.6%
Assyrians/Chaldeans/Syriacs
99.8
/100
|
#34
Exceptional
13.6%