Chilean vs Puget Sound Salish Single Male Poverty
COMPARE
Chilean
Puget Sound Salish
Single Male Poverty
Single Male Poverty Comparison
Chileans
Puget Sound Salish
11.9%
SINGLE MALE POVERTY
99.5/ 100
METRIC RATING
74th/ 347
METRIC RANK
12.8%
SINGLE MALE POVERTY
54.3/ 100
METRIC RATING
169th/ 347
METRIC RANK
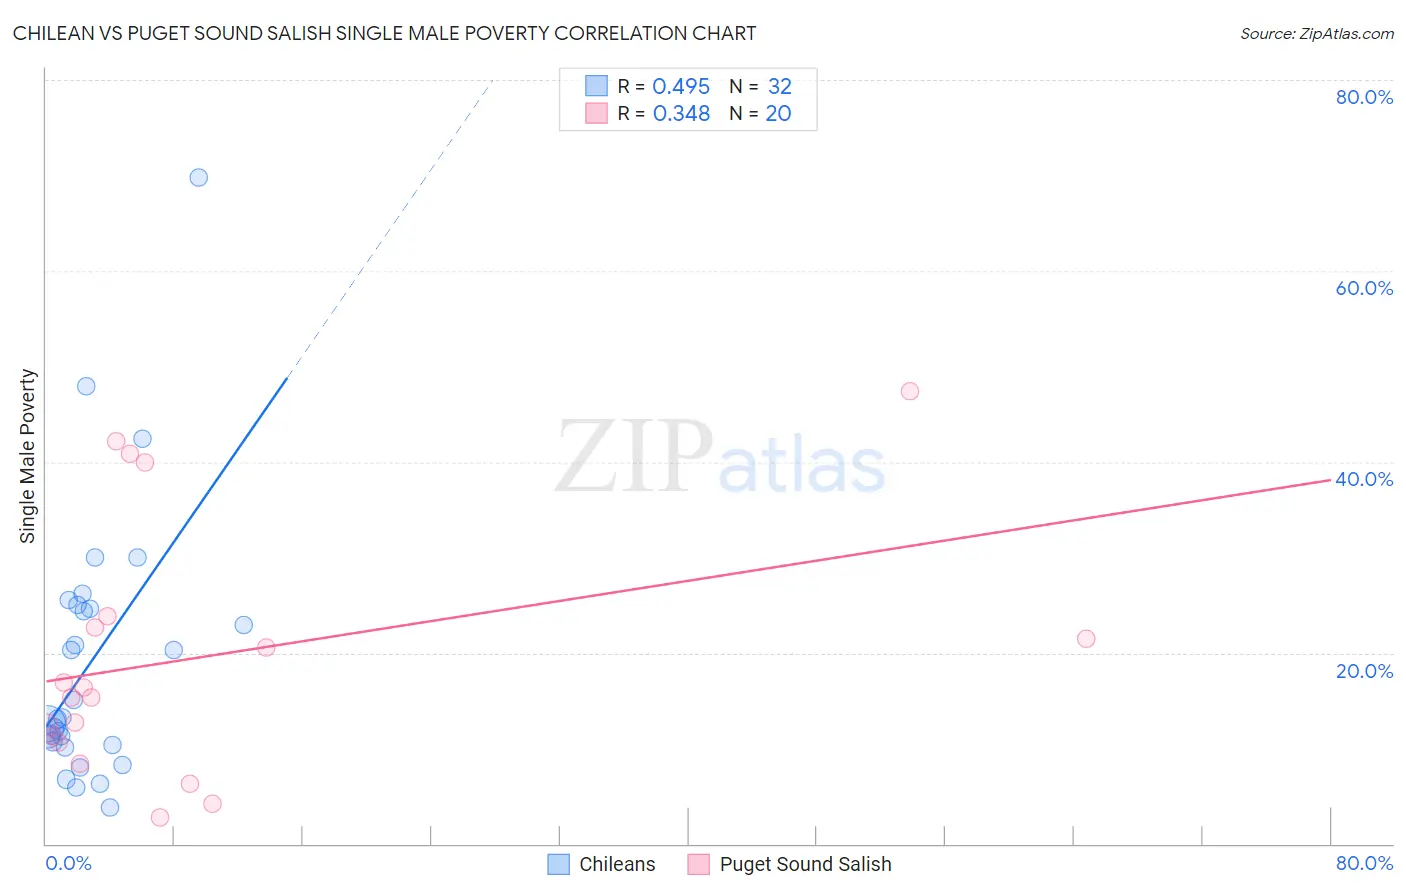
Chilean vs Puget Sound Salish Single Male Poverty Correlation Chart
The statistical analysis conducted on geographies consisting of 235,919,497 people shows a moderate positive correlation between the proportion of Chileans and poverty level among single males in the United States with a correlation coefficient (R) of 0.495 and weighted average of 11.9%. Similarly, the statistical analysis conducted on geographies consisting of 44,306,636 people shows a mild positive correlation between the proportion of Puget Sound Salish and poverty level among single males in the United States with a correlation coefficient (R) of 0.348 and weighted average of 12.8%, a difference of 7.1%.
Single Male Poverty Correlation Summary
| Measurement | Chilean | Puget Sound Salish |
| Minimum | 3.8% | 2.8% |
| Maximum | 69.8% | 47.4% |
| Range | 66.0% | 44.6% |
| Mean | 19.1% | 19.6% |
| Median | 13.1% | 15.9% |
| Interquartile 25% (IQ1) | 10.5% | 10.9% |
| Interquartile 75% (IQ3) | 24.9% | 23.3% |
| Interquartile Range (IQR) | 14.3% | 12.4% |
| Standard Deviation (Sample) | 13.9% | 13.2% |
| Standard Deviation (Population) | 13.7% | 12.9% |
Similar Demographics by Single Male Poverty
Demographics Similar to Chileans by Single Male Poverty
In terms of single male poverty, the demographic groups most similar to Chileans are Argentinean (11.9%, a difference of 0.060%), Immigrants from Argentina (11.9%, a difference of 0.18%), Uruguayan (11.9%, a difference of 0.19%), Immigrants from Northern Africa (11.9%, a difference of 0.22%), and Immigrants from Greece (11.9%, a difference of 0.36%).
| Demographics | Rating | Rank | Single Male Poverty |
| Immigrants | Ukraine | 99.6 /100 | #67 | Exceptional 11.9% |
| Immigrants | Croatia | 99.6 /100 | #68 | Exceptional 11.9% |
| Immigrants | Russia | 99.6 /100 | #69 | Exceptional 11.9% |
| Immigrants | Nepal | 99.6 /100 | #70 | Exceptional 11.9% |
| Immigrants | Greece | 99.6 /100 | #71 | Exceptional 11.9% |
| Immigrants | Argentina | 99.5 /100 | #72 | Exceptional 11.9% |
| Argentineans | 99.5 /100 | #73 | Exceptional 11.9% |
| Chileans | 99.5 /100 | #74 | Exceptional 11.9% |
| Uruguayans | 99.4 /100 | #75 | Exceptional 11.9% |
| Immigrants | Northern Africa | 99.4 /100 | #76 | Exceptional 11.9% |
| Immigrants | Malaysia | 99.2 /100 | #77 | Exceptional 12.0% |
| Immigrants | Venezuela | 99.1 /100 | #78 | Exceptional 12.0% |
| Immigrants | Belgium | 99.0 /100 | #79 | Exceptional 12.0% |
| Armenians | 98.7 /100 | #80 | Exceptional 12.1% |
| Immigrants | South America | 98.7 /100 | #81 | Exceptional 12.1% |
Demographics Similar to Puget Sound Salish by Single Male Poverty
In terms of single male poverty, the demographic groups most similar to Puget Sound Salish are Guyanese (12.8%, a difference of 0.12%), South African (12.8%, a difference of 0.15%), Danish (12.8%, a difference of 0.15%), Immigrants from Barbados (12.7%, a difference of 0.18%), and Immigrants from St. Vincent and the Grenadines (12.8%, a difference of 0.18%).
| Demographics | Rating | Rank | Single Male Poverty |
| Eastern Europeans | 63.3 /100 | #162 | Good 12.7% |
| Palestinians | 63.1 /100 | #163 | Good 12.7% |
| Immigrants | Nigeria | 62.8 /100 | #164 | Good 12.7% |
| Immigrants | Cambodia | 62.2 /100 | #165 | Good 12.7% |
| Immigrants | Guyana | 60.5 /100 | #166 | Good 12.7% |
| Immigrants | Sudan | 58.2 /100 | #167 | Average 12.7% |
| Immigrants | Barbados | 57.7 /100 | #168 | Average 12.7% |
| Puget Sound Salish | 54.3 /100 | #169 | Average 12.8% |
| Guyanese | 52.0 /100 | #170 | Average 12.8% |
| South Africans | 51.5 /100 | #171 | Average 12.8% |
| Danes | 51.4 /100 | #172 | Average 12.8% |
| Immigrants | St. Vincent and the Grenadines | 50.9 /100 | #173 | Average 12.8% |
| Costa Ricans | 50.0 /100 | #174 | Average 12.8% |
| Croatians | 48.9 /100 | #175 | Average 12.8% |
| Syrians | 48.4 /100 | #176 | Average 12.8% |