Chilean vs Paraguayan Single Male Poverty
COMPARE
Chilean
Paraguayan
Single Male Poverty
Single Male Poverty Comparison
Chileans
Paraguayans
11.9%
SINGLE MALE POVERTY
99.5/ 100
METRIC RATING
74th/ 347
METRIC RANK
11.6%
SINGLE MALE POVERTY
99.9/ 100
METRIC RATING
51st/ 347
METRIC RANK
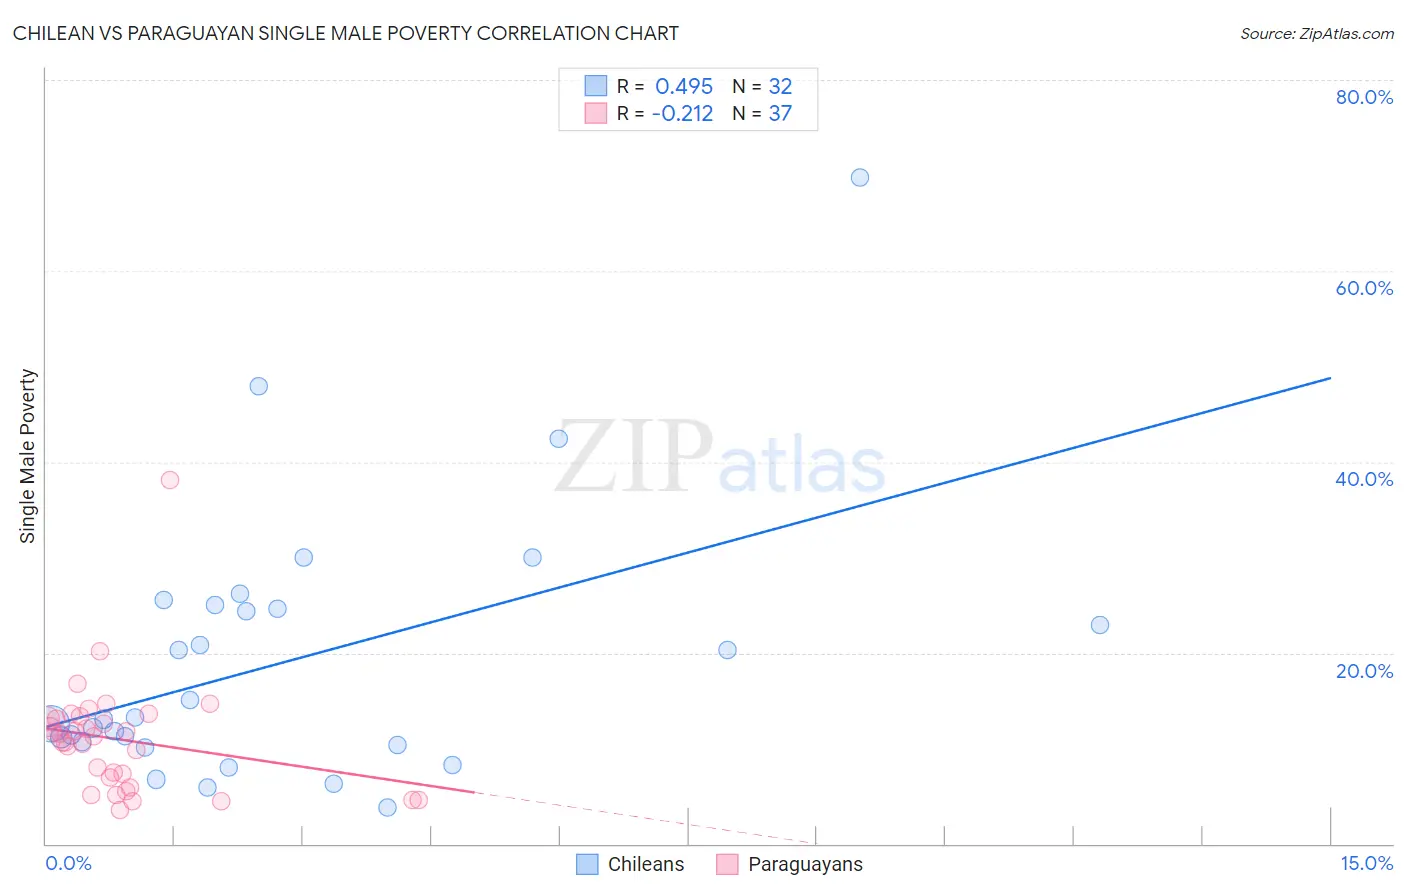
Chilean vs Paraguayan Single Male Poverty Correlation Chart
The statistical analysis conducted on geographies consisting of 235,919,497 people shows a moderate positive correlation between the proportion of Chileans and poverty level among single males in the United States with a correlation coefficient (R) of 0.495 and weighted average of 11.9%. Similarly, the statistical analysis conducted on geographies consisting of 90,716,103 people shows a weak negative correlation between the proportion of Paraguayans and poverty level among single males in the United States with a correlation coefficient (R) of -0.212 and weighted average of 11.6%, a difference of 2.6%.
Single Male Poverty Correlation Summary
| Measurement | Chilean | Paraguayan |
| Minimum | 3.8% | 3.6% |
| Maximum | 69.8% | 38.1% |
| Range | 66.0% | 34.5% |
| Mean | 19.1% | 10.9% |
| Median | 13.1% | 11.3% |
| Interquartile 25% (IQ1) | 10.5% | 6.4% |
| Interquartile 75% (IQ3) | 24.9% | 13.2% |
| Interquartile Range (IQR) | 14.3% | 6.8% |
| Standard Deviation (Sample) | 13.9% | 6.1% |
| Standard Deviation (Population) | 13.7% | 6.0% |
Similar Demographics by Single Male Poverty
Demographics Similar to Chileans by Single Male Poverty
In terms of single male poverty, the demographic groups most similar to Chileans are Argentinean (11.9%, a difference of 0.060%), Immigrants from Argentina (11.9%, a difference of 0.18%), Uruguayan (11.9%, a difference of 0.19%), Immigrants from Northern Africa (11.9%, a difference of 0.22%), and Immigrants from Greece (11.9%, a difference of 0.36%).
| Demographics | Rating | Rank | Single Male Poverty |
| Immigrants | Ukraine | 99.6 /100 | #67 | Exceptional 11.9% |
| Immigrants | Croatia | 99.6 /100 | #68 | Exceptional 11.9% |
| Immigrants | Russia | 99.6 /100 | #69 | Exceptional 11.9% |
| Immigrants | Nepal | 99.6 /100 | #70 | Exceptional 11.9% |
| Immigrants | Greece | 99.6 /100 | #71 | Exceptional 11.9% |
| Immigrants | Argentina | 99.5 /100 | #72 | Exceptional 11.9% |
| Argentineans | 99.5 /100 | #73 | Exceptional 11.9% |
| Chileans | 99.5 /100 | #74 | Exceptional 11.9% |
| Uruguayans | 99.4 /100 | #75 | Exceptional 11.9% |
| Immigrants | Northern Africa | 99.4 /100 | #76 | Exceptional 11.9% |
| Immigrants | Malaysia | 99.2 /100 | #77 | Exceptional 12.0% |
| Immigrants | Venezuela | 99.1 /100 | #78 | Exceptional 12.0% |
| Immigrants | Belgium | 99.0 /100 | #79 | Exceptional 12.0% |
| Armenians | 98.7 /100 | #80 | Exceptional 12.1% |
| Immigrants | South America | 98.7 /100 | #81 | Exceptional 12.1% |
Demographics Similar to Paraguayans by Single Male Poverty
In terms of single male poverty, the demographic groups most similar to Paraguayans are Immigrants from Lithuania (11.6%, a difference of 0.11%), Tlingit-Haida (11.6%, a difference of 0.17%), Immigrants from Indonesia (11.6%, a difference of 0.19%), Nepalese (11.6%, a difference of 0.26%), and Samoan (11.7%, a difference of 0.31%).
| Demographics | Rating | Rank | Single Male Poverty |
| Immigrants | Cameroon | 99.9 /100 | #44 | Exceptional 11.5% |
| Immigrants | Poland | 99.9 /100 | #45 | Exceptional 11.5% |
| Immigrants | Bulgaria | 99.9 /100 | #46 | Exceptional 11.6% |
| Nepalese | 99.9 /100 | #47 | Exceptional 11.6% |
| Immigrants | Indonesia | 99.9 /100 | #48 | Exceptional 11.6% |
| Tlingit-Haida | 99.9 /100 | #49 | Exceptional 11.6% |
| Immigrants | Lithuania | 99.9 /100 | #50 | Exceptional 11.6% |
| Paraguayans | 99.9 /100 | #51 | Exceptional 11.6% |
| Samoans | 99.9 /100 | #52 | Exceptional 11.7% |
| Bulgarians | 99.9 /100 | #53 | Exceptional 11.7% |
| Immigrants | Uzbekistan | 99.9 /100 | #54 | Exceptional 11.7% |
| Cypriots | 99.9 /100 | #55 | Exceptional 11.7% |
| Burmese | 99.8 /100 | #56 | Exceptional 11.7% |
| Immigrants | Romania | 99.8 /100 | #57 | Exceptional 11.7% |
| Immigrants | Brazil | 99.8 /100 | #58 | Exceptional 11.7% |