Chilean vs Mongolian Family Poverty
COMPARE
Chilean
Mongolian
Family Poverty
Family Poverty Comparison
Chileans
Mongolians
8.5%
FAMILY POVERTY
86.6/ 100
METRIC RATING
134th/ 347
METRIC RANK
8.6%
FAMILY POVERTY
80.4/ 100
METRIC RATING
149th/ 347
METRIC RANK
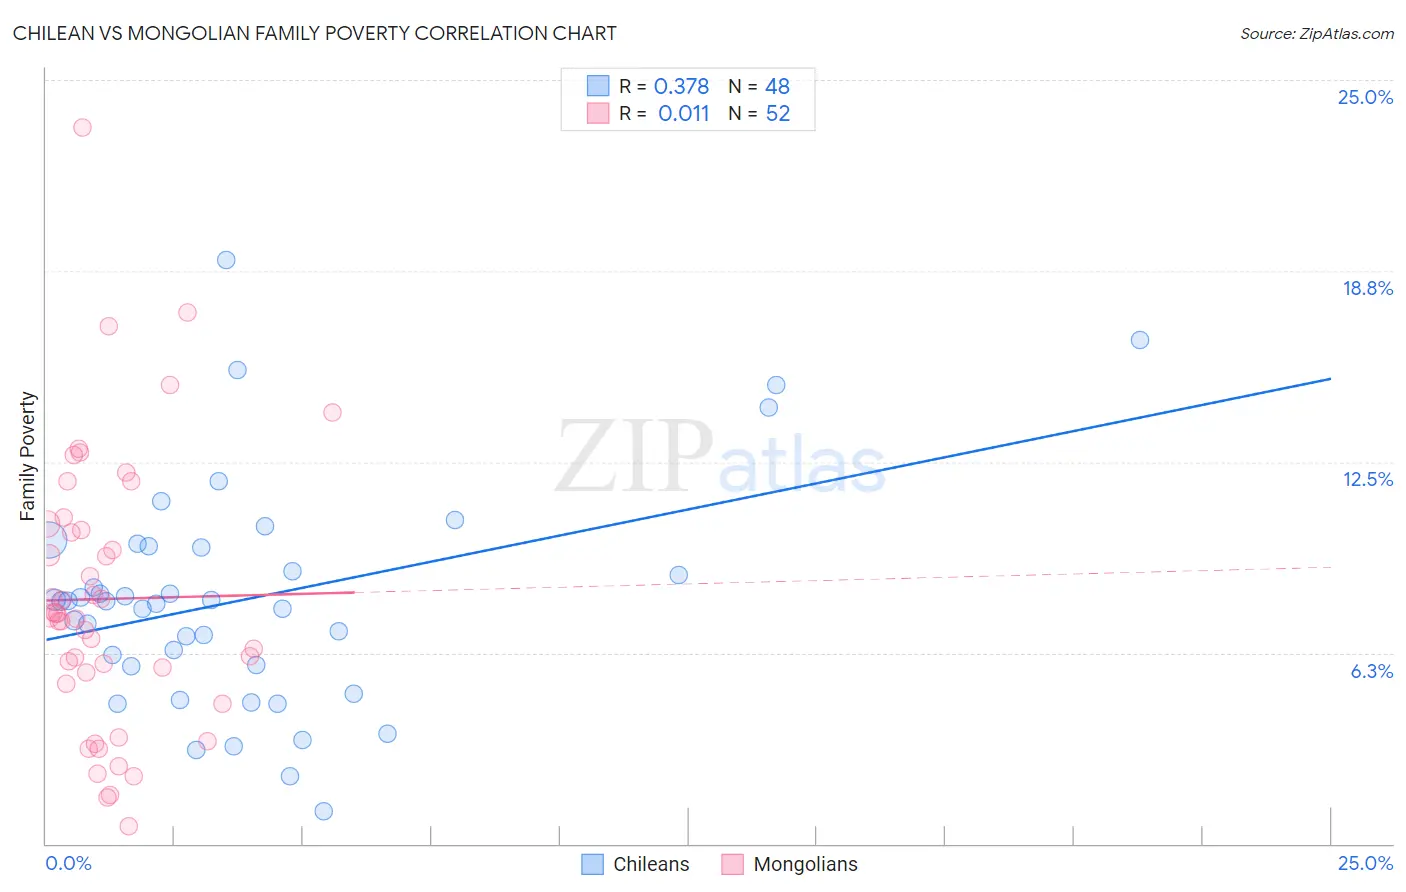
Chilean vs Mongolian Family Poverty Correlation Chart
The statistical analysis conducted on geographies consisting of 256,264,406 people shows a mild positive correlation between the proportion of Chileans and poverty level among families in the United States with a correlation coefficient (R) of 0.378 and weighted average of 8.5%. Similarly, the statistical analysis conducted on geographies consisting of 140,209,736 people shows no correlation between the proportion of Mongolians and poverty level among families in the United States with a correlation coefficient (R) of 0.011 and weighted average of 8.6%, a difference of 1.6%.
Family Poverty Correlation Summary
| Measurement | Chilean | Mongolian |
| Minimum | 1.0% | 0.58% |
| Maximum | 19.1% | 23.4% |
| Range | 18.1% | 22.8% |
| Mean | 8.0% | 8.0% |
| Median | 7.9% | 7.5% |
| Interquartile 25% (IQ1) | 5.8% | 5.4% |
| Interquartile 75% (IQ3) | 9.7% | 10.4% |
| Interquartile Range (IQR) | 3.9% | 4.9% |
| Standard Deviation (Sample) | 3.7% | 4.5% |
| Standard Deviation (Population) | 3.6% | 4.5% |
Demographics Similar to Chileans and Mongolians by Family Poverty
In terms of family poverty, the demographic groups most similar to Chileans are Sri Lankan (8.5%, a difference of 0.010%), Immigrants from Malaysia (8.5%, a difference of 0.040%), Immigrants from Brazil (8.5%, a difference of 0.080%), Immigrants from Southern Europe (8.5%, a difference of 0.16%), and Immigrants from Argentina (8.4%, a difference of 0.51%). Similarly, the demographic groups most similar to Mongolians are Syrian (8.6%, a difference of 0.0%), Brazilian (8.6%, a difference of 0.050%), Scotch-Irish (8.6%, a difference of 0.41%), Immigrants from Jordan (8.5%, a difference of 0.62%), and Immigrants from Belarus (8.5%, a difference of 0.65%).
| Demographics | Rating | Rank | Family Poverty |
| Puget Sound Salish | 88.6 /100 | #131 | Excellent 8.4% |
| Immigrants | Argentina | 88.2 /100 | #132 | Excellent 8.4% |
| Sri Lankans | 86.6 /100 | #133 | Excellent 8.5% |
| Chileans | 86.6 /100 | #134 | Excellent 8.5% |
| Immigrants | Malaysia | 86.5 /100 | #135 | Excellent 8.5% |
| Immigrants | Brazil | 86.3 /100 | #136 | Excellent 8.5% |
| Immigrants | Southern Europe | 86.0 /100 | #137 | Excellent 8.5% |
| Armenians | 84.6 /100 | #138 | Excellent 8.5% |
| Immigrants | Nepal | 84.2 /100 | #139 | Excellent 8.5% |
| Immigrants | Kazakhstan | 84.1 /100 | #140 | Excellent 8.5% |
| Immigrants | Ukraine | 83.9 /100 | #141 | Excellent 8.5% |
| Yugoslavians | 83.5 /100 | #142 | Excellent 8.5% |
| Immigrants | Germany | 83.3 /100 | #143 | Excellent 8.5% |
| Albanians | 83.3 /100 | #144 | Excellent 8.5% |
| Immigrants | South Eastern Asia | 83.2 /100 | #145 | Excellent 8.5% |
| Immigrants | Belarus | 83.2 /100 | #146 | Excellent 8.5% |
| Immigrants | Jordan | 83.0 /100 | #147 | Excellent 8.5% |
| Scotch-Irish | 82.2 /100 | #148 | Excellent 8.6% |
| Mongolians | 80.4 /100 | #149 | Excellent 8.6% |
| Syrians | 80.3 /100 | #150 | Excellent 8.6% |
| Brazilians | 80.1 /100 | #151 | Excellent 8.6% |