Chilean vs Immigrants from Caribbean Single Female Poverty
COMPARE
Chilean
Immigrants from Caribbean
Single Female Poverty
Single Female Poverty Comparison
Chileans
Immigrants from Caribbean
19.9%
SINGLE FEMALE POVERTY
96.9/ 100
METRIC RATING
104th/ 347
METRIC RANK
22.4%
SINGLE FEMALE POVERTY
1.3/ 100
METRIC RATING
249th/ 347
METRIC RANK
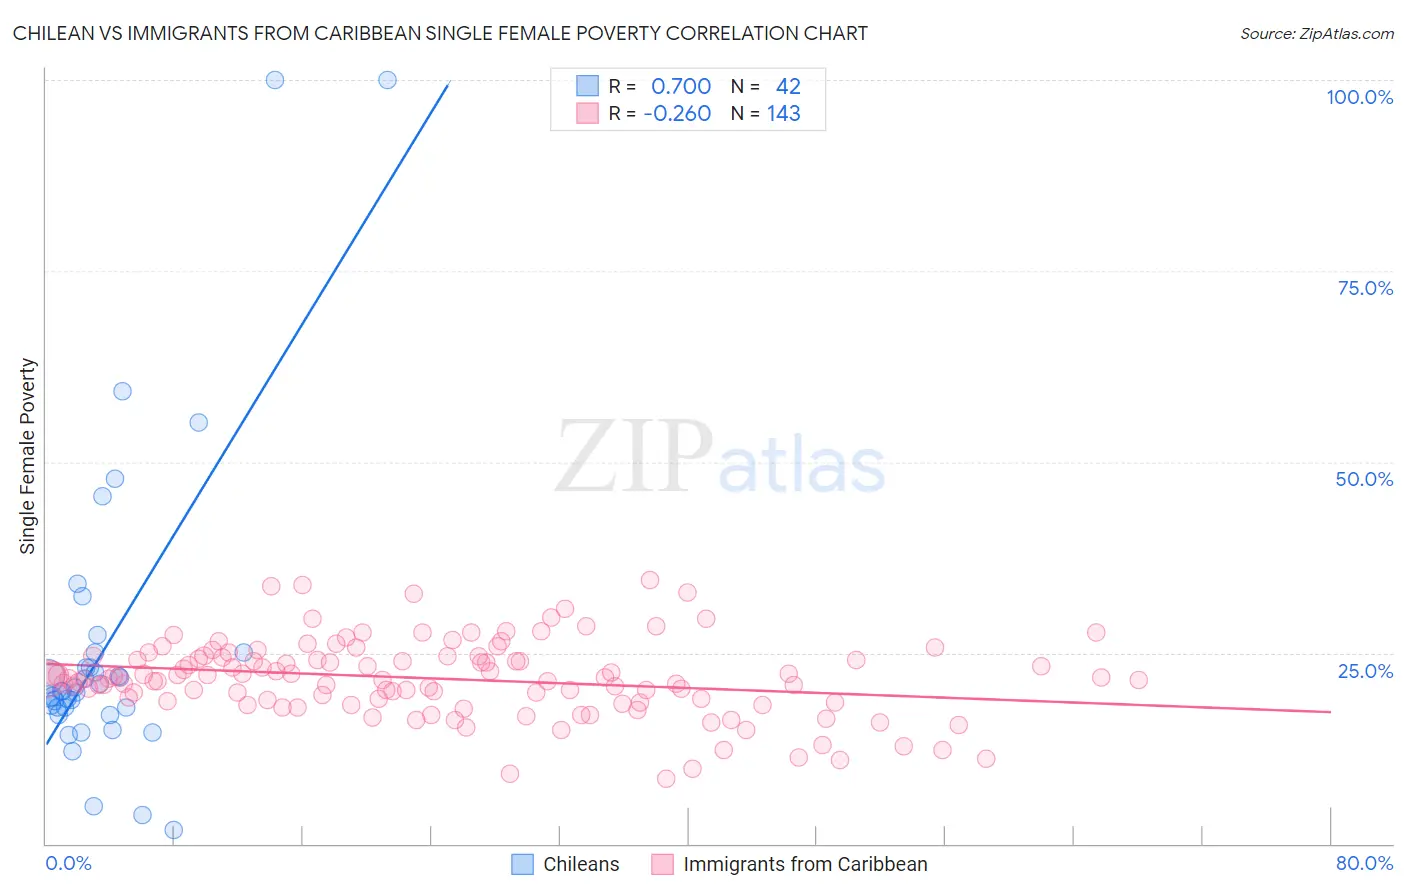
Chilean vs Immigrants from Caribbean Single Female Poverty Correlation Chart
The statistical analysis conducted on geographies consisting of 254,415,237 people shows a strong positive correlation between the proportion of Chileans and poverty level among single females in the United States with a correlation coefficient (R) of 0.700 and weighted average of 19.9%. Similarly, the statistical analysis conducted on geographies consisting of 441,756,238 people shows a weak negative correlation between the proportion of Immigrants from Caribbean and poverty level among single females in the United States with a correlation coefficient (R) of -0.260 and weighted average of 22.4%, a difference of 12.8%.
Single Female Poverty Correlation Summary
| Measurement | Chilean | Immigrants from Caribbean |
| Minimum | 1.8% | 8.5% |
| Maximum | 100.0% | 34.5% |
| Range | 98.2% | 25.9% |
| Mean | 25.9% | 21.6% |
| Median | 19.9% | 21.7% |
| Interquartile 25% (IQ1) | 17.8% | 18.7% |
| Interquartile 75% (IQ3) | 25.0% | 24.6% |
| Interquartile Range (IQR) | 7.2% | 5.9% |
| Standard Deviation (Sample) | 20.4% | 5.0% |
| Standard Deviation (Population) | 20.1% | 5.0% |
Similar Demographics by Single Female Poverty
Demographics Similar to Chileans by Single Female Poverty
In terms of single female poverty, the demographic groups most similar to Chileans are Israeli (19.9%, a difference of 0.010%), Ethiopian (19.9%, a difference of 0.10%), Immigrants from Southern Europe (19.9%, a difference of 0.12%), Immigrants from Syria (19.9%, a difference of 0.12%), and Native Hawaiian (19.9%, a difference of 0.17%).
| Demographics | Rating | Rank | Single Female Poverty |
| Croatians | 98.1 /100 | #97 | Exceptional 19.7% |
| Immigrants | France | 97.9 /100 | #98 | Exceptional 19.7% |
| Sierra Leoneans | 97.9 /100 | #99 | Exceptional 19.7% |
| Ukrainians | 97.6 /100 | #100 | Exceptional 19.8% |
| Immigrants | Belgium | 97.3 /100 | #101 | Exceptional 19.8% |
| Immigrants | Cameroon | 97.3 /100 | #102 | Exceptional 19.8% |
| Immigrants | Southern Europe | 97.1 /100 | #103 | Exceptional 19.9% |
| Chileans | 96.9 /100 | #104 | Exceptional 19.9% |
| Israelis | 96.9 /100 | #105 | Exceptional 19.9% |
| Ethiopians | 96.7 /100 | #106 | Exceptional 19.9% |
| Immigrants | Syria | 96.7 /100 | #107 | Exceptional 19.9% |
| Native Hawaiians | 96.6 /100 | #108 | Exceptional 19.9% |
| Colombians | 96.6 /100 | #109 | Exceptional 19.9% |
| Immigrants | Western Asia | 96.5 /100 | #110 | Exceptional 19.9% |
| Carpatho Rusyns | 96.1 /100 | #111 | Exceptional 20.0% |
Demographics Similar to Immigrants from Caribbean by Single Female Poverty
In terms of single female poverty, the demographic groups most similar to Immigrants from Caribbean are Belizean (22.4%, a difference of 0.10%), Immigrants from El Salvador (22.4%, a difference of 0.11%), Immigrants from Bahamas (22.5%, a difference of 0.15%), Liberian (22.4%, a difference of 0.17%), and Immigrants from West Indies (22.5%, a difference of 0.29%).
| Demographics | Rating | Rank | Single Female Poverty |
| Bermudans | 2.0 /100 | #242 | Tragic 22.3% |
| West Indians | 1.9 /100 | #243 | Tragic 22.3% |
| Immigrants | Middle Africa | 1.9 /100 | #244 | Tragic 22.3% |
| Immigrants | Bangladesh | 1.8 /100 | #245 | Tragic 22.3% |
| Liberians | 1.4 /100 | #246 | Tragic 22.4% |
| Immigrants | El Salvador | 1.4 /100 | #247 | Tragic 22.4% |
| Belizeans | 1.4 /100 | #248 | Tragic 22.4% |
| Immigrants | Caribbean | 1.3 /100 | #249 | Tragic 22.4% |
| Immigrants | Bahamas | 1.2 /100 | #250 | Tragic 22.5% |
| Immigrants | West Indies | 1.0 /100 | #251 | Tragic 22.5% |
| Delaware | 1.0 /100 | #252 | Tragic 22.5% |
| Immigrants | Liberia | 0.9 /100 | #253 | Tragic 22.5% |
| Immigrants | Burma/Myanmar | 0.8 /100 | #254 | Tragic 22.6% |
| Immigrants | Sudan | 0.8 /100 | #255 | Tragic 22.6% |
| Immigrants | Belize | 0.8 /100 | #256 | Tragic 22.6% |