Chilean vs Bermudan Male Poverty
COMPARE
Chilean
Bermudan
Male Poverty
Male Poverty Comparison
Chileans
Bermudans
10.7%
MALE POVERTY
83.9/ 100
METRIC RATING
130th/ 347
METRIC RANK
12.2%
MALE POVERTY
2.4/ 100
METRIC RATING
219th/ 347
METRIC RANK
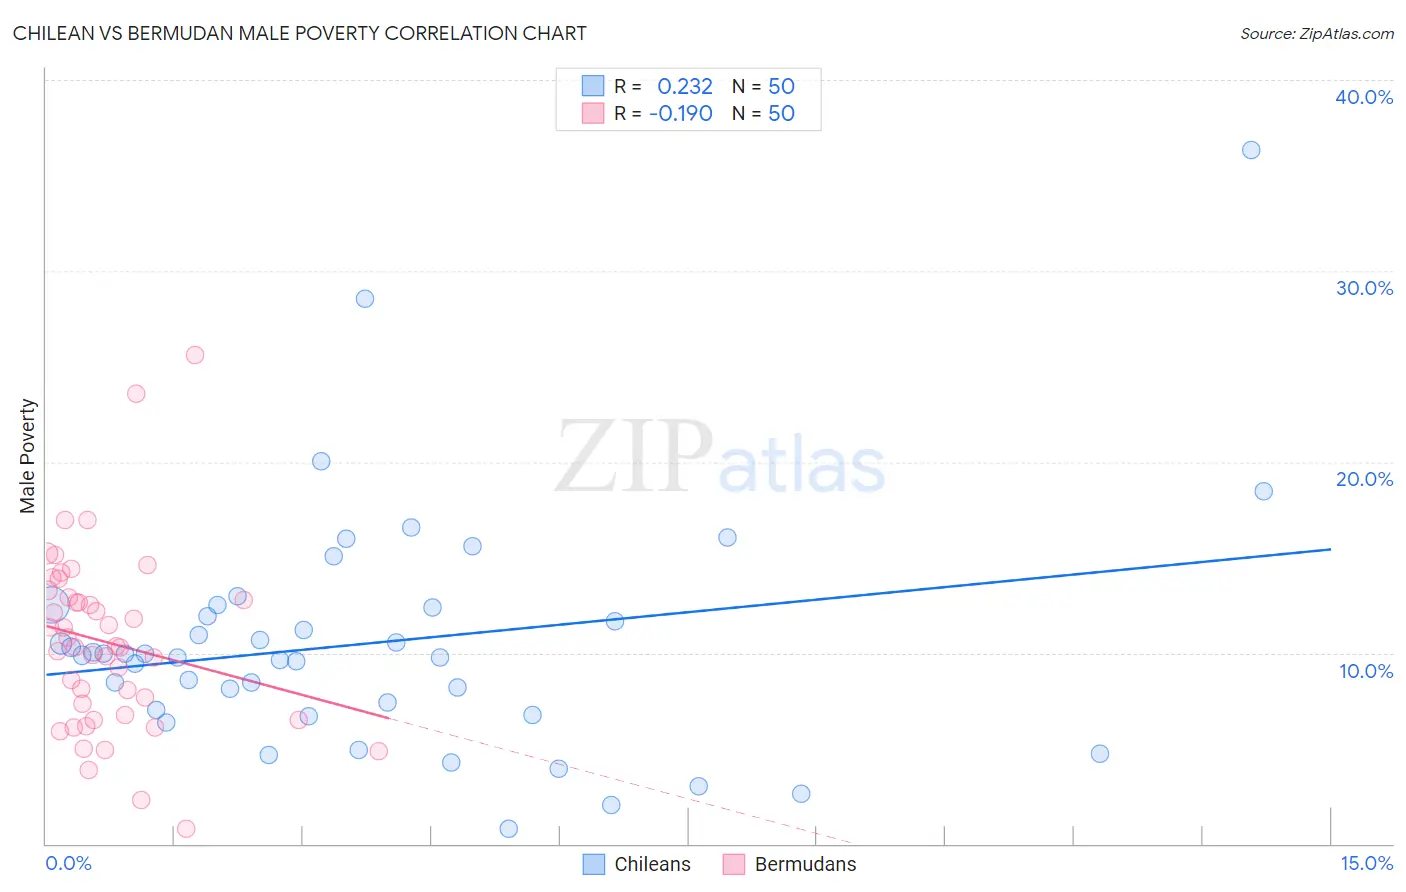
Chilean vs Bermudan Male Poverty Correlation Chart
The statistical analysis conducted on geographies consisting of 256,512,426 people shows a weak positive correlation between the proportion of Chileans and poverty level among males in the United States with a correlation coefficient (R) of 0.232 and weighted average of 10.7%. Similarly, the statistical analysis conducted on geographies consisting of 55,715,607 people shows a poor negative correlation between the proportion of Bermudans and poverty level among males in the United States with a correlation coefficient (R) of -0.190 and weighted average of 12.2%, a difference of 13.7%.
Male Poverty Correlation Summary
| Measurement | Chilean | Bermudan |
| Minimum | 0.80% | 0.81% |
| Maximum | 36.4% | 25.6% |
| Range | 35.6% | 24.8% |
| Mean | 10.5% | 10.5% |
| Median | 9.9% | 10.3% |
| Interquartile 25% (IQ1) | 7.0% | 6.7% |
| Interquartile 75% (IQ3) | 12.4% | 12.9% |
| Interquartile Range (IQR) | 5.3% | 6.2% |
| Standard Deviation (Sample) | 6.2% | 4.7% |
| Standard Deviation (Population) | 6.1% | 4.7% |
Similar Demographics by Male Poverty
Demographics Similar to Chileans by Male Poverty
In terms of male poverty, the demographic groups most similar to Chileans are Immigrants from Peru (10.7%, a difference of 0.050%), Immigrants from Western Europe (10.7%, a difference of 0.060%), Puget Sound Salish (10.7%, a difference of 0.070%), Immigrants from Ukraine (10.7%, a difference of 0.080%), and Immigrants from Belarus (10.7%, a difference of 0.11%).
| Demographics | Rating | Rank | Male Poverty |
| South Africans | 86.8 /100 | #123 | Excellent 10.7% |
| French | 86.7 /100 | #124 | Excellent 10.7% |
| Immigrants | Norway | 86.0 /100 | #125 | Excellent 10.7% |
| Immigrants | Ukraine | 84.3 /100 | #126 | Excellent 10.7% |
| Puget Sound Salish | 84.3 /100 | #127 | Excellent 10.7% |
| Immigrants | Western Europe | 84.2 /100 | #128 | Excellent 10.7% |
| Immigrants | Peru | 84.1 /100 | #129 | Excellent 10.7% |
| Chileans | 83.9 /100 | #130 | Excellent 10.7% |
| Immigrants | Belarus | 83.3 /100 | #131 | Excellent 10.7% |
| Immigrants | Vietnam | 83.0 /100 | #132 | Excellent 10.8% |
| Pakistanis | 83.0 /100 | #133 | Excellent 10.8% |
| New Zealanders | 82.9 /100 | #134 | Excellent 10.8% |
| Brazilians | 82.7 /100 | #135 | Excellent 10.8% |
| Immigrants | Israel | 80.9 /100 | #136 | Excellent 10.8% |
| Immigrants | Switzerland | 79.2 /100 | #137 | Good 10.8% |
Demographics Similar to Bermudans by Male Poverty
In terms of male poverty, the demographic groups most similar to Bermudans are Immigrants from Eritrea (12.2%, a difference of 0.020%), German Russian (12.2%, a difference of 0.070%), Immigrants from Thailand (12.2%, a difference of 0.090%), Immigrants from Cambodia (12.2%, a difference of 0.10%), and Immigrants from Uzbekistan (12.2%, a difference of 0.18%).
| Demographics | Rating | Rank | Male Poverty |
| Americans | 3.2 /100 | #212 | Tragic 12.1% |
| Immigrants | Nonimmigrants | 3.1 /100 | #213 | Tragic 12.1% |
| Japanese | 2.7 /100 | #214 | Tragic 12.2% |
| Immigrants | Uzbekistan | 2.6 /100 | #215 | Tragic 12.2% |
| Immigrants | Cambodia | 2.5 /100 | #216 | Tragic 12.2% |
| Immigrants | Thailand | 2.5 /100 | #217 | Tragic 12.2% |
| German Russians | 2.5 /100 | #218 | Tragic 12.2% |
| Bermudans | 2.4 /100 | #219 | Tragic 12.2% |
| Immigrants | Eritrea | 2.4 /100 | #220 | Tragic 12.2% |
| Ugandans | 2.2 /100 | #221 | Tragic 12.2% |
| Immigrants | Africa | 2.1 /100 | #222 | Tragic 12.2% |
| Immigrants | Micronesia | 2.1 /100 | #223 | Tragic 12.2% |
| Immigrants | Nigeria | 1.6 /100 | #224 | Tragic 12.3% |
| Osage | 1.5 /100 | #225 | Tragic 12.3% |
| Nigerians | 1.4 /100 | #226 | Tragic 12.3% |