Chickasaw vs Syrian Female Poverty
COMPARE
Chickasaw
Syrian
Female Poverty
Female Poverty Comparison
Chickasaw
Syrians
15.9%
FEMALE POVERTY
0.1/ 100
METRIC RATING
270th/ 347
METRIC RANK
13.0%
FEMALE POVERTY
79.6/ 100
METRIC RATING
145th/ 347
METRIC RANK
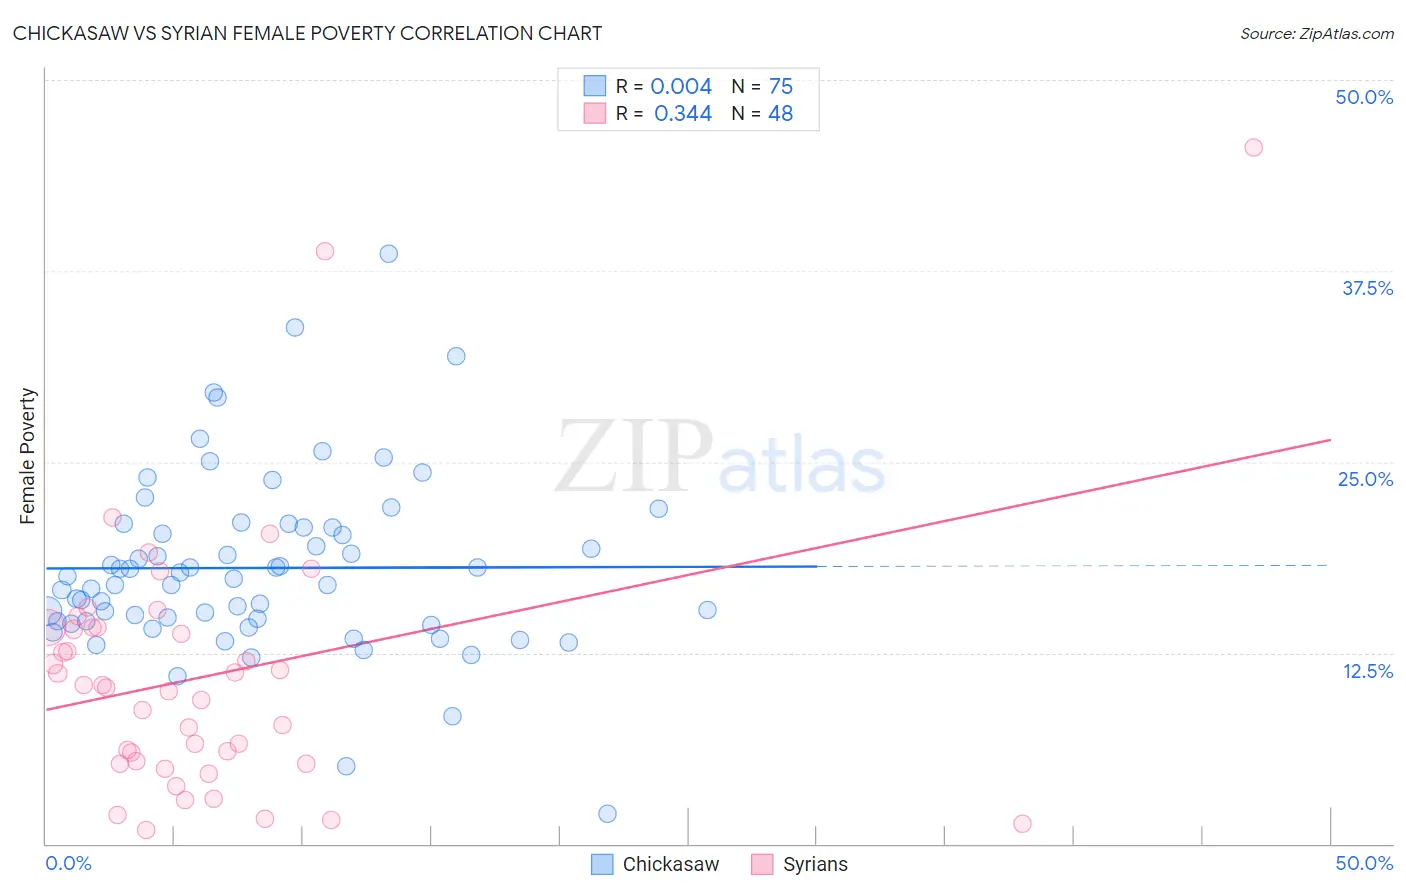
Chickasaw vs Syrian Female Poverty Correlation Chart
The statistical analysis conducted on geographies consisting of 147,658,289 people shows no correlation between the proportion of Chickasaw and poverty level among females in the United States with a correlation coefficient (R) of 0.004 and weighted average of 15.9%. Similarly, the statistical analysis conducted on geographies consisting of 266,159,377 people shows a mild positive correlation between the proportion of Syrians and poverty level among females in the United States with a correlation coefficient (R) of 0.344 and weighted average of 13.0%, a difference of 22.0%.
Female Poverty Correlation Summary
| Measurement | Chickasaw | Syrian |
| Minimum | 1.9% | 0.87% |
| Maximum | 38.6% | 45.6% |
| Range | 36.7% | 44.7% |
| Mean | 18.1% | 11.0% |
| Median | 17.3% | 10.3% |
| Interquartile 25% (IQ1) | 14.6% | 5.3% |
| Interquartile 75% (IQ3) | 20.7% | 14.1% |
| Interquartile Range (IQR) | 6.1% | 8.8% |
| Standard Deviation (Sample) | 5.9% | 8.5% |
| Standard Deviation (Population) | 5.9% | 8.4% |
Similar Demographics by Female Poverty
Demographics Similar to Chickasaw by Female Poverty
In terms of female poverty, the demographic groups most similar to Chickasaw are Iroquois (15.8%, a difference of 0.26%), Immigrants from St. Vincent and the Grenadines (15.9%, a difference of 0.28%), Belizean (15.9%, a difference of 0.50%), Haitian (15.9%, a difference of 0.51%), and Barbadian (15.9%, a difference of 0.51%).
| Demographics | Rating | Rank | Female Poverty |
| Cherokee | 0.1 /100 | #263 | Tragic 15.6% |
| Immigrants | Ecuador | 0.1 /100 | #264 | Tragic 15.6% |
| Immigrants | Liberia | 0.1 /100 | #265 | Tragic 15.7% |
| Immigrants | El Salvador | 0.1 /100 | #266 | Tragic 15.7% |
| Sub-Saharan Africans | 0.1 /100 | #267 | Tragic 15.8% |
| Immigrants | Nicaragua | 0.1 /100 | #268 | Tragic 15.8% |
| Iroquois | 0.1 /100 | #269 | Tragic 15.8% |
| Chickasaw | 0.1 /100 | #270 | Tragic 15.9% |
| Immigrants | St. Vincent and the Grenadines | 0.0 /100 | #271 | Tragic 15.9% |
| Belizeans | 0.0 /100 | #272 | Tragic 15.9% |
| Haitians | 0.0 /100 | #273 | Tragic 15.9% |
| Barbadians | 0.0 /100 | #274 | Tragic 15.9% |
| Immigrants | Barbados | 0.0 /100 | #275 | Tragic 16.0% |
| Central Americans | 0.0 /100 | #276 | Tragic 16.0% |
| Bangladeshis | 0.0 /100 | #277 | Tragic 16.0% |
Demographics Similar to Syrians by Female Poverty
In terms of female poverty, the demographic groups most similar to Syrians are Afghan (13.0%, a difference of 0.030%), Immigrants from Peru (13.0%, a difference of 0.080%), Immigrants from Malaysia (13.0%, a difference of 0.12%), Brazilian (13.0%, a difference of 0.14%), and Immigrants from Kazakhstan (13.0%, a difference of 0.16%).
| Demographics | Rating | Rank | Female Poverty |
| Immigrants | France | 83.6 /100 | #138 | Excellent 12.9% |
| Basques | 83.1 /100 | #139 | Excellent 12.9% |
| Pakistanis | 83.0 /100 | #140 | Excellent 12.9% |
| Icelanders | 81.1 /100 | #141 | Excellent 13.0% |
| Brazilians | 80.5 /100 | #142 | Excellent 13.0% |
| Immigrants | Malaysia | 80.4 /100 | #143 | Excellent 13.0% |
| Afghans | 79.8 /100 | #144 | Good 13.0% |
| Syrians | 79.6 /100 | #145 | Good 13.0% |
| Immigrants | Peru | 79.1 /100 | #146 | Good 13.0% |
| Immigrants | Kazakhstan | 78.6 /100 | #147 | Good 13.0% |
| Yugoslavians | 76.9 /100 | #148 | Good 13.1% |
| Taiwanese | 75.7 /100 | #149 | Good 13.1% |
| Tsimshian | 75.5 /100 | #150 | Good 13.1% |
| Immigrants | Germany | 74.9 /100 | #151 | Good 13.1% |
| Samoans | 73.6 /100 | #152 | Good 13.1% |