Chickasaw vs Immigrants from Congo Child Poverty Under the Age of 5

COMPARE

Chickasaw
Race
Ancestry
AfghanAfricanAlaska NativeAlaskan AthabascanAlbanianAleutAlsatianAmericanApacheArabArapahoArgentineanArmenianAssyrian/Chaldean/SyriacAustralianAustrianBahamianBangladeshiBarbadianBasqueBelgianBelizeanBermudanBhutaneseBlackfeetBolivianBrazilianBritishBritish West IndianBulgarianBurmeseCajunCambodianCanadianCape VerdeanCarpatho RusynCelticCentral AmericanCentral American IndianCherokeeCheyenneChickasawChileanChineseChippewaChoctawColombianColvilleComancheCosta RicanCreeCreekCroatianCrowCubanCypriotCzechCzechoslovakianDanishDelawareDominicanDutchDutch West IndianEastern EuropeanEcuadorianEgyptianEnglishEstonianEthiopianEuropeanFijianFilipinoFinnishFrenchFrench American IndianFrench CanadianGermanGerman RussianGhanaianGreekGuamanian/ChamorroGuatemalanGuyaneseHaitianHmongHonduranHopiHoumaHungarianIcelanderIndian (Asian)IndonesianInupiatIranianIraqiIrishIroquoisIsraeliItalianJamaicanJapaneseJordanianKenyanKiowaKoreanLaotianLatvianLebaneseLiberianLithuanianLumbeeLuxembourgerMacedonianMalaysianMalteseMarshalleseMenomineeMexicanMexican American IndianMongolianMoroccanNative HawaiianNavajoNepaleseNew ZealanderNicaraguanNigerianNorthern EuropeanNorwegianOkinawanOsageOttawaPaiutePakistaniPalestinianPanamanianParaguayanPennsylvania GermanPeruvianPimaPolishPortuguesePotawatomiPuebloPuerto RicanPuget Sound SalishRomanianRussianSalvadoranSamoanScandinavianScotch-IrishScottishSeminoleSenegaleseSerbianShoshoneSierra LeoneanSiouxSlavicSlovakSloveneSomaliSouth AfricanSouth AmericanSouth American IndianSoviet UnionSpaniardSpanishSpanish AmericanSpanish American IndianSri LankanSubsaharan AfricanSudaneseSwedishSwissSyrianTaiwaneseThaiTlingit-HaidaTohono O'OdhamTonganTrinidadian and TobagonianTsimshianTurkishU.S. Virgin IslanderUgandanUkrainianUruguayanUteVenezuelanVietnameseWelshWest IndianYakamaYaquiYugoslavianYumanYup'ikZimbabwean
Immigration
NonimmigrantsImmigrantsAfghanistanAfricaAlbaniaArgentinaArmeniaAsiaAustraliaAustriaBahamasBangladeshBarbadosBelarusBelgiumBelizeBoliviaBosnia and HerzegovinaBrazilBulgariaBurma/MyanmarCabo VerdeCambodiaCameroonCanadaCaribbeanCentral AmericaChileChinaColombiaCosta RicaCroatiaCubaCzechoslovakiaDenmarkDominicaDominican RepublicEastern AfricaEastern AsiaEastern EuropeEcuadorEgyptEl SalvadorEnglandEritreaEthiopiaEuropeFijiFranceGermanyGhanaGreeceGrenadaGuatemalaGuyanaHaitiHondurasHong KongHungaryIndiaIndonesiaIranIraqIrelandIsraelItalyJamaicaJapanJordanKazakhstanKenyaKoreaKuwaitLaosLatin AmericaLatviaLebanonLiberiaLithuaniaMalaysiaMexicoMicronesiaMiddle AfricaMoldovaMoroccoNepalNetherlandsNicaraguaNigeriaNorth AmericaNorth MacedoniaNorthern AfricaNorthern EuropeNorwayOceaniaPakistanPanamaPeruPhilippinesPolandPortugalRomaniaRussiaSaudi ArabiaScotlandSenegalSerbiaSierra LeoneSingaporeSomaliaSouth AfricaSouth AmericaSouth Central AsiaSouth Eastern AsiaSouthern EuropeSpainSri LankaSt. Vincent and the GrenadinesSudanSwedenSwitzerlandSyriaTaiwanThailandTrinidad and TobagoTurkeyUgandaUkraineUruguayUzbekistanVenezuelaVietnamWest IndiesWestern AfricaWestern AsiaWestern EuropeYemenZaireZimbabweAzores
Immigrants from Congo
Race
Ancestry
AfghanAfricanAlaska NativeAlaskan AthabascanAlbanianAleutAlsatianAmericanApacheArabArapahoArgentineanArmenianAssyrian/Chaldean/SyriacAustralianAustrianBahamianBangladeshiBarbadianBasqueBelgianBelizeanBermudanBhutaneseBlackfeetBolivianBrazilianBritishBritish West IndianBulgarianBurmeseCajunCambodianCanadianCape VerdeanCarpatho RusynCelticCentral AmericanCentral American IndianCherokeeCheyenneChileanChineseChippewaChoctawColombianColvilleComancheCosta RicanCreeCreekCroatianCrowCubanCypriotCzechCzechoslovakianDanishDelawareDominicanDutchDutch West IndianEastern EuropeanEcuadorianEgyptianEnglishEstonianEthiopianEuropeanFijianFilipinoFinnishFrenchFrench American IndianFrench CanadianGermanGerman RussianGhanaianGreekGuamanian/ChamorroGuatemalanGuyaneseHaitianHmongHonduranHopiHoumaHungarianIcelanderIndian (Asian)IndonesianInupiatIranianIraqiIrishIroquoisIsraeliItalianJamaicanJapaneseJordanianKenyanKiowaKoreanLaotianLatvianLebaneseLiberianLithuanianLumbeeLuxembourgerMacedonianMalaysianMalteseMarshalleseMenomineeMexicanMexican American IndianMongolianMoroccanNative HawaiianNavajoNepaleseNew ZealanderNicaraguanNigerianNorthern EuropeanNorwegianOkinawanOsageOttawaPaiutePakistaniPalestinianPanamanianParaguayanPennsylvania GermanPeruvianPimaPolishPortuguesePotawatomiPuebloPuerto RicanPuget Sound SalishRomanianRussianSalvadoranSamoanScandinavianScotch-IrishScottishSeminoleSenegaleseSerbianShoshoneSierra LeoneanSiouxSlavicSlovakSloveneSomaliSouth AfricanSouth AmericanSouth American IndianSoviet UnionSpaniardSpanishSpanish AmericanSpanish American IndianSri LankanSubsaharan AfricanSudaneseSwedishSwissSyrianTaiwaneseThaiTlingit-HaidaTohono O'OdhamTonganTrinidadian and TobagonianTsimshianTurkishU.S. Virgin IslanderUgandanUkrainianUruguayanUteVenezuelanVietnameseWelshWest IndianYakamaYaquiYugoslavianYumanYup'ikZimbabwean
Immigration
NonimmigrantsImmigrantsAfghanistanAfricaAlbaniaArgentinaArmeniaAsiaAustraliaAustriaBahamasBangladeshBarbadosBelarusBelgiumBelizeBoliviaBosnia and HerzegovinaBrazilBulgariaBurma/MyanmarCabo VerdeCambodiaCameroonCanadaCaribbeanCentral AmericaChileChinaColombiaCongoCosta RicaCroatiaCubaCzechoslovakiaDenmarkDominicaDominican RepublicEastern AfricaEastern AsiaEastern EuropeEcuadorEgyptEl SalvadorEnglandEritreaEthiopiaEuropeFijiFranceGermanyGhanaGreeceGrenadaGuatemalaGuyanaHaitiHondurasHong KongHungaryIndiaIndonesiaIranIraqIrelandIsraelItalyJamaicaJapanJordanKazakhstanKenyaKoreaKuwaitLaosLatin AmericaLatviaLebanonLiberiaLithuaniaMalaysiaMexicoMicronesiaMiddle AfricaMoldovaMoroccoNepalNetherlandsNicaraguaNigeriaNorth AmericaNorth MacedoniaNorthern AfricaNorthern EuropeNorwayOceaniaPakistanPanamaPeruPhilippinesPolandPortugalRomaniaRussiaSaudi ArabiaScotlandSenegalSerbiaSierra LeoneSingaporeSomaliaSouth AfricaSouth AmericaSouth Central AsiaSouth Eastern AsiaSouthern EuropeSpainSri LankaSt. Vincent and the GrenadinesSudanSwedenSwitzerlandSyriaTaiwanThailandTrinidad and TobagoTurkeyUgandaUkraineUruguayUzbekistanVenezuelaVietnamWest IndiesWestern AfricaWestern AsiaWestern EuropeYemenZaireZimbabweAzores
Child Poverty Under the Age of 5
Income
Poverty
Unemployment
Labor Participation
Family Structure
Vehicle Availability
Education Level
Disability

Child Poverty Under the Age of 5 Comparison

Chickasaw

Immigrants from Congo

Tragic
Tragic
21.8%
CHILD POVERTY UNDER THE AGE OF 5
0.0/ 100
METRIC RATING
299th/ 347
METRIC RANK
23.9%
CHILD POVERTY UNDER THE AGE OF 5
0.0/ 100
METRIC RATING
325th/ 347
METRIC RANK

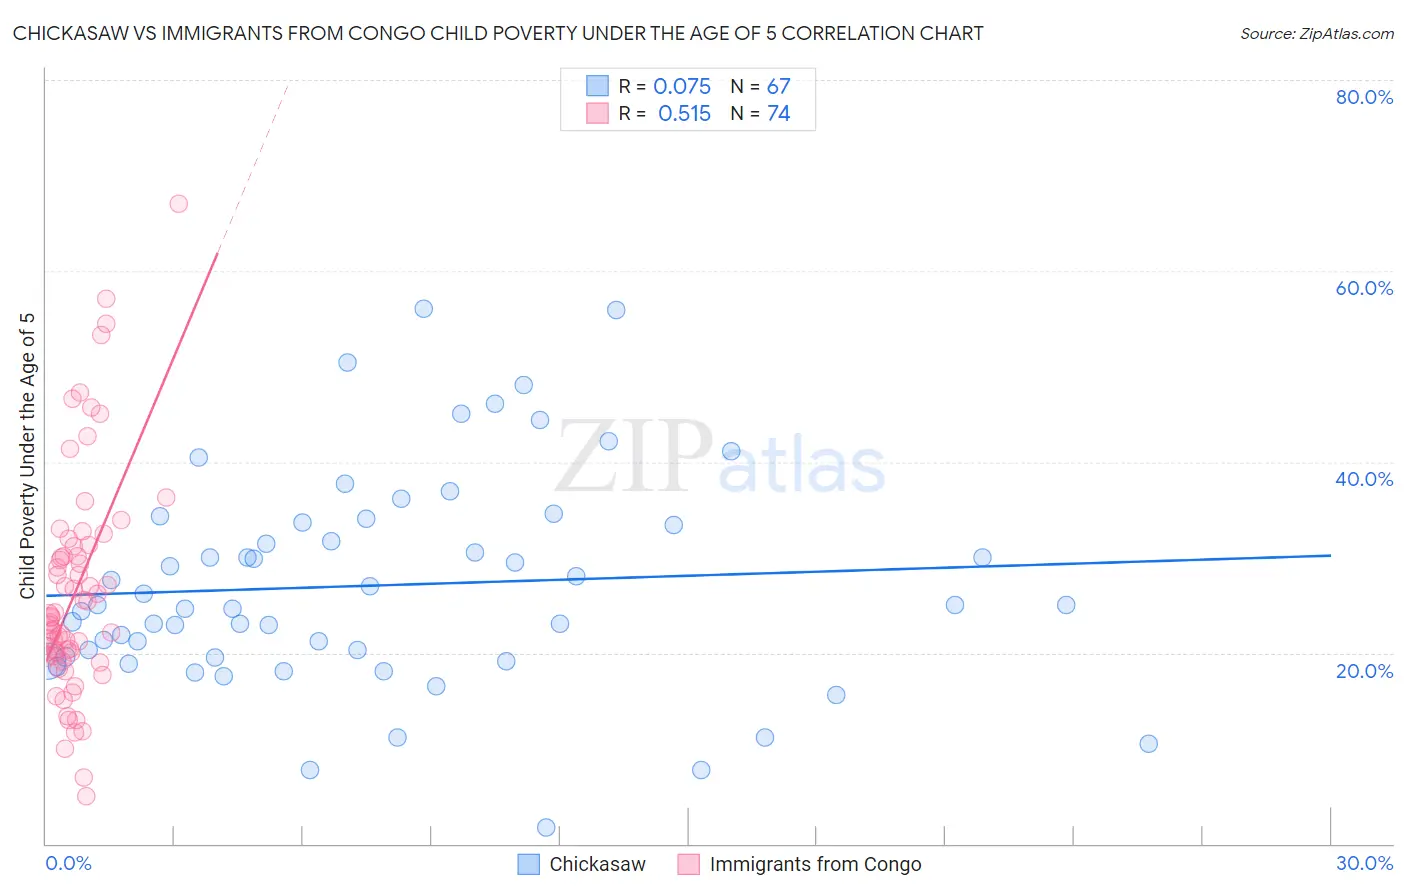
Chickasaw vs Immigrants from Congo Child Poverty Under the Age of 5 Correlation Chart

The statistical analysis conducted on geographies consisting of 145,649,363 people shows a slight positive correlation between the proportion of Chickasaw and poverty level among children under the age of 5 in the United States with a correlation coefficient (R) of 0.075 and weighted average of 21.8%. Similarly, the statistical analysis conducted on geographies consisting of 91,481,308 people shows a substantial positive correlation between the proportion of Immigrants from Congo and poverty level among children under the age of 5 in the United States with a correlation coefficient (R) of 0.515 and weighted average of 23.9%, a difference of 9.4%.
Chickasaw vs Immigrants from Congo Child Poverty Under the Age of 5

Child Poverty Under the Age of 5 Correlation Summary

MeasurementChickasawImmigrants from Congo
Minimum1.7%5.0%
Maximum56.1%67.1%
Range54.4%62.1%
Mean27.1%26.4%
Median25.0%23.8%
Interquartile 25% (IQ1)19.5%19.7%
Interquartile 75% (IQ3)33.6%31.1%
Interquartile Range (IQR)14.1%11.4%
Standard Deviation (Sample)11.3%11.8%
Standard Deviation (Population)11.2%11.7%

Similar Demographics by Child Poverty Under the Age of 5

Demographics Similar to Chickasaw by Child Poverty Under the Age of 5

In terms of child poverty under the age of 5, the demographic groups most similar to Chickasaw are Blackfeet (21.8%, a difference of 0.0%), Alaskan Athabascan (21.8%, a difference of 0.010%), Hispanic or Latino (21.7%, a difference of 0.39%), Yaqui (21.7%, a difference of 0.41%), and Cherokee (21.7%, a difference of 0.56%).
DemographicsRating | RankChild Poverty Under the Age of 5
Immigrants | Somalia
0.0
/100
|
#292
Tragic
21.6%
Mexicans
0.0
/100
|
#293
Tragic
21.6%
Guatemalans
0.0
/100
|
#294
Tragic
21.6%
Cherokee
0.0
/100
|
#295
Tragic
21.7%
Yaqui
0.0
/100
|
#296
Tragic
21.7%
Hispanics or Latinos
0.0
/100
|
#297
Tragic
21.7%
Blackfeet
0.0
/100
|
#298
Tragic
21.8%
Chickasaw
0.0
/100
|
#299
Tragic
21.8%
Alaskan Athabascans
0.0
/100
|
#300
Tragic
21.8%
Immigrants | Central America
0.0
/100
|
#301
Tragic
22.0%
Iroquois
0.0
/100
|
#302
Tragic
22.0%
Inupiat
0.0
/100
|
#303
Tragic
22.0%
Immigrants | Guatemala
0.0
/100
|
#304
Tragic
22.0%
Immigrants | Mexico
0.0
/100
|
#305
Tragic
22.2%
Indonesians
0.0
/100
|
#306
Tragic
22.3%

Demographics Similar to Immigrants from Congo by Child Poverty Under the Age of 5

In terms of child poverty under the age of 5, the demographic groups most similar to Immigrants from Congo are Central American Indian (23.9%, a difference of 0.18%), Paiute (23.8%, a difference of 0.21%), Dominican (24.0%, a difference of 0.64%), Immigrants from Dominican Republic (24.1%, a difference of 0.73%), and Pueblo (23.7%, a difference of 0.82%).
DemographicsRating | RankChild Poverty Under the Age of 5
Dutch West Indians
0.0
/100
|
#318
Tragic
23.3%
Chippewa
0.0
/100
|
#319
Tragic
23.4%
Choctaw
0.0
/100
|
#320
Tragic
23.5%
Immigrants | Honduras
0.0
/100
|
#321
Tragic
23.5%
Ute
0.0
/100
|
#322
Tragic
23.5%
Pueblo
0.0
/100
|
#323
Tragic
23.7%
Paiute
0.0
/100
|
#324
Tragic
23.8%
Immigrants | Congo
0.0
/100
|
#325
Tragic
23.9%
Central American Indians
0.0
/100
|
#326
Tragic
23.9%
Dominicans
0.0
/100
|
#327
Tragic
24.0%
Immigrants | Dominican Republic
0.0
/100
|
#328
Tragic
24.1%
Cajuns
0.0
/100
|
#329
Tragic
24.1%
Creek
0.0
/100
|
#330
Tragic
24.2%
Kiowa
0.0
/100
|
#331
Tragic
24.5%
Apache
0.0
/100
|
#332
Tragic
25.0%