Cheyenne vs Immigrants from Zaire Child Poverty Among Girls Under 16
COMPARE
Cheyenne
Immigrants from Zaire
Child Poverty Among Girls Under 16
Child Poverty Among Girls Under 16 Comparison
Cheyenne
Immigrants from Zaire
26.3%
CHILD POVERTY AMONG GIRLS UNDER 16
0.0/ 100
METRIC RATING
338th/ 347
METRIC RANK
20.2%
CHILD POVERTY AMONG GIRLS UNDER 16
0.0/ 100
METRIC RATING
279th/ 347
METRIC RANK
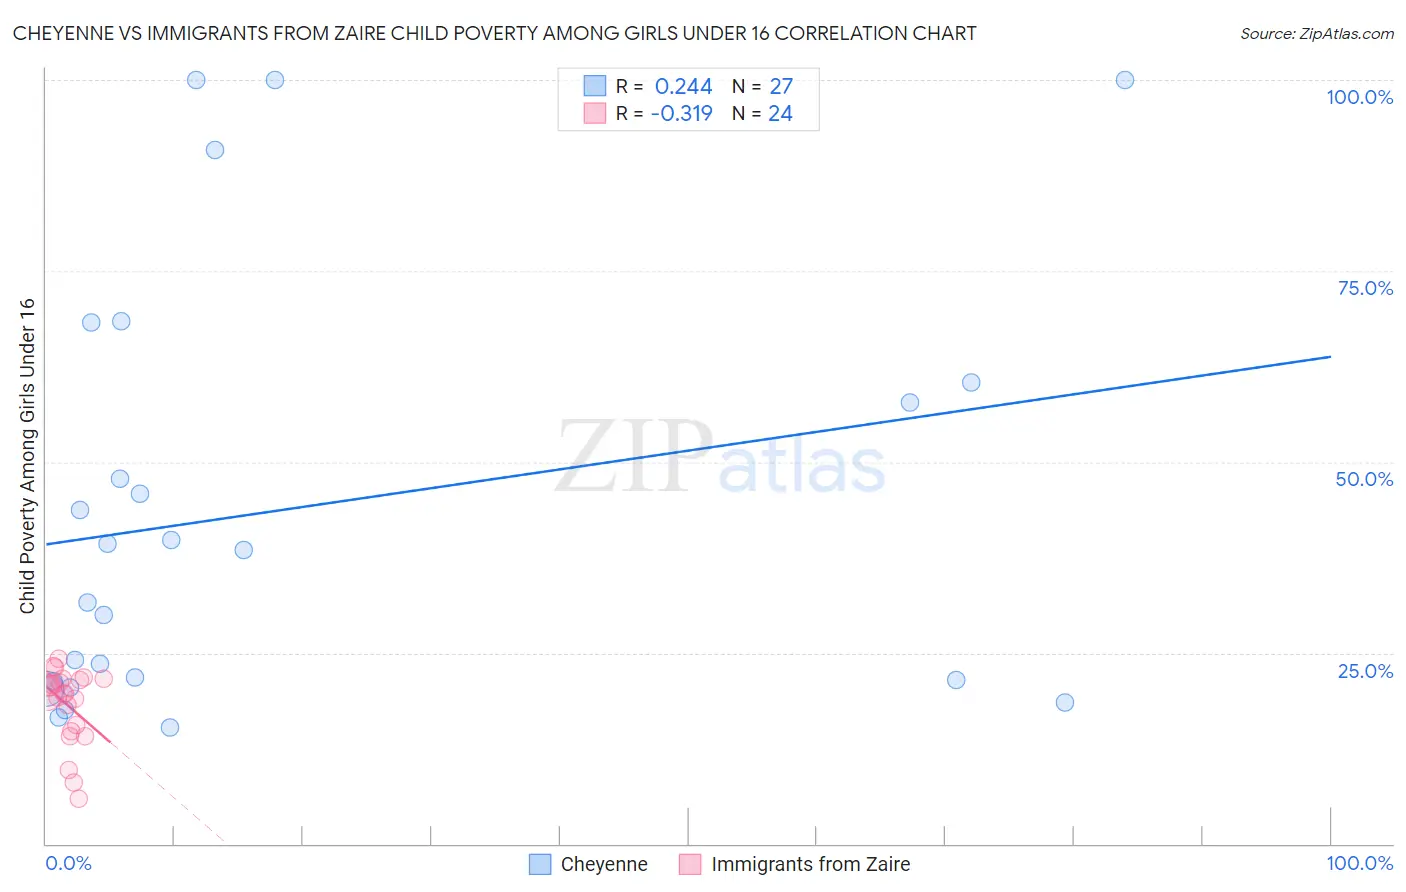
Cheyenne vs Immigrants from Zaire Child Poverty Among Girls Under 16 Correlation Chart
The statistical analysis conducted on geographies consisting of 80,342,731 people shows a weak positive correlation between the proportion of Cheyenne and poverty level among girls under the age of 16 in the United States with a correlation coefficient (R) of 0.244 and weighted average of 26.3%. Similarly, the statistical analysis conducted on geographies consisting of 106,950,173 people shows a mild negative correlation between the proportion of Immigrants from Zaire and poverty level among girls under the age of 16 in the United States with a correlation coefficient (R) of -0.319 and weighted average of 20.2%, a difference of 29.9%.
Child Poverty Among Girls Under 16 Correlation Summary
| Measurement | Cheyenne | Immigrants from Zaire |
| Minimum | 15.2% | 5.9% |
| Maximum | 100.0% | 24.2% |
| Range | 84.8% | 18.4% |
| Mean | 43.8% | 18.2% |
| Median | 38.5% | 19.8% |
| Interquartile 25% (IQ1) | 21.3% | 15.1% |
| Interquartile 75% (IQ3) | 60.4% | 21.5% |
| Interquartile Range (IQR) | 39.1% | 6.4% |
| Standard Deviation (Sample) | 27.8% | 4.9% |
| Standard Deviation (Population) | 27.3% | 4.8% |
Similar Demographics by Child Poverty Among Girls Under 16
Demographics Similar to Cheyenne by Child Poverty Among Girls Under 16
In terms of child poverty among girls under 16, the demographic groups most similar to Cheyenne are Crow (26.4%, a difference of 0.34%), Yup'ik (25.8%, a difference of 1.8%), Sioux (25.6%, a difference of 2.7%), Yuman (27.1%, a difference of 3.1%), and Pueblo (25.2%, a difference of 4.3%).
| Demographics | Rating | Rank | Child Poverty Among Girls Under 16 |
| Apache | 0.0 /100 | #331 | Tragic 23.8% |
| Natives/Alaskans | 0.0 /100 | #332 | Tragic 24.0% |
| Blacks/African Americans | 0.0 /100 | #333 | Tragic 24.7% |
| Menominee | 0.0 /100 | #334 | Tragic 25.0% |
| Pueblo | 0.0 /100 | #335 | Tragic 25.2% |
| Sioux | 0.0 /100 | #336 | Tragic 25.6% |
| Yup'ik | 0.0 /100 | #337 | Tragic 25.8% |
| Cheyenne | 0.0 /100 | #338 | Tragic 26.3% |
| Crow | 0.0 /100 | #339 | Tragic 26.4% |
| Yuman | 0.0 /100 | #340 | Tragic 27.1% |
| Hopi | 0.0 /100 | #341 | Tragic 27.9% |
| Pima | 0.0 /100 | #342 | Tragic 28.2% |
| Immigrants | Yemen | 0.0 /100 | #343 | Tragic 29.5% |
| Navajo | 0.0 /100 | #344 | Tragic 30.5% |
| Lumbee | 0.0 /100 | #345 | Tragic 30.7% |
Demographics Similar to Immigrants from Zaire by Child Poverty Among Girls Under 16
In terms of child poverty among girls under 16, the demographic groups most similar to Immigrants from Zaire are Immigrants from Liberia (20.2%, a difference of 0.010%), Central American (20.2%, a difference of 0.080%), Barbadian (20.2%, a difference of 0.13%), Belizean (20.2%, a difference of 0.16%), and Comanche (20.2%, a difference of 0.27%).
| Demographics | Rating | Rank | Child Poverty Among Girls Under 16 |
| Immigrants | El Salvador | 0.1 /100 | #272 | Tragic 20.0% |
| Bangladeshis | 0.1 /100 | #273 | Tragic 20.0% |
| Immigrants | St. Vincent and the Grenadines | 0.0 /100 | #274 | Tragic 20.1% |
| Sub-Saharan Africans | 0.0 /100 | #275 | Tragic 20.1% |
| Comanche | 0.0 /100 | #276 | Tragic 20.2% |
| Belizeans | 0.0 /100 | #277 | Tragic 20.2% |
| Barbadians | 0.0 /100 | #278 | Tragic 20.2% |
| Immigrants | Zaire | 0.0 /100 | #279 | Tragic 20.2% |
| Immigrants | Liberia | 0.0 /100 | #280 | Tragic 20.2% |
| Central Americans | 0.0 /100 | #281 | Tragic 20.2% |
| West Indians | 0.0 /100 | #282 | Tragic 20.3% |
| Senegalese | 0.0 /100 | #283 | Tragic 20.3% |
| Yaqui | 0.0 /100 | #284 | Tragic 20.3% |
| Immigrants | Cabo Verde | 0.0 /100 | #285 | Tragic 20.3% |
| Iroquois | 0.0 /100 | #286 | Tragic 20.4% |