Central American vs Paiute Female Poverty
COMPARE
Central American
Paiute
Female Poverty
Female Poverty Comparison
Central Americans
Paiute
16.0%
FEMALE POVERTY
0.0/ 100
METRIC RATING
276th/ 347
METRIC RANK
17.7%
FEMALE POVERTY
0.0/ 100
METRIC RATING
323rd/ 347
METRIC RANK
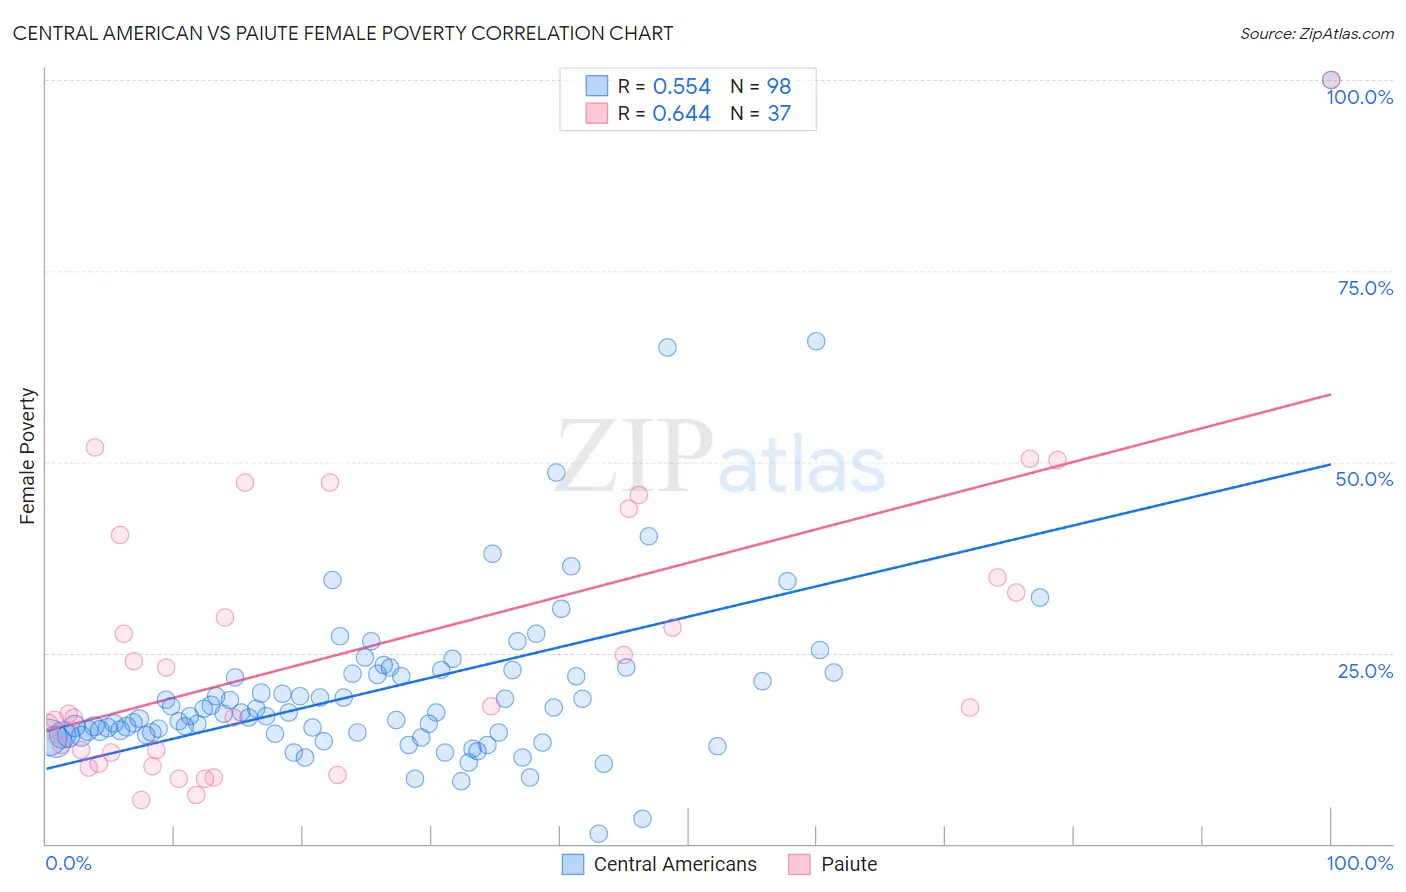
Central American vs Paiute Female Poverty Correlation Chart
The statistical analysis conducted on geographies consisting of 503,924,730 people shows a substantial positive correlation between the proportion of Central Americans and poverty level among females in the United States with a correlation coefficient (R) of 0.554 and weighted average of 16.0%. Similarly, the statistical analysis conducted on geographies consisting of 58,391,472 people shows a significant positive correlation between the proportion of Paiute and poverty level among females in the United States with a correlation coefficient (R) of 0.644 and weighted average of 17.7%, a difference of 10.8%.
Female Poverty Correlation Summary
| Measurement | Central American | Paiute |
| Minimum | 1.3% | 5.7% |
| Maximum | 100.0% | 100.0% |
| Range | 98.8% | 94.3% |
| Mean | 20.2% | 25.6% |
| Median | 16.9% | 17.8% |
| Interquartile 25% (IQ1) | 14.3% | 11.2% |
| Interquartile 75% (IQ3) | 22.2% | 37.6% |
| Interquartile Range (IQR) | 7.9% | 26.4% |
| Standard Deviation (Sample) | 12.8% | 19.3% |
| Standard Deviation (Population) | 12.8% | 19.0% |
Similar Demographics by Female Poverty
Demographics Similar to Central Americans by Female Poverty
In terms of female poverty, the demographic groups most similar to Central Americans are Immigrants from Barbados (16.0%, a difference of 0.13%), Barbadian (15.9%, a difference of 0.19%), Bangladeshi (16.0%, a difference of 0.19%), Belizean (15.9%, a difference of 0.20%), and Haitian (15.9%, a difference of 0.20%).
| Demographics | Rating | Rank | Female Poverty |
| Iroquois | 0.1 /100 | #269 | Tragic 15.8% |
| Chickasaw | 0.1 /100 | #270 | Tragic 15.9% |
| Immigrants | St. Vincent and the Grenadines | 0.0 /100 | #271 | Tragic 15.9% |
| Belizeans | 0.0 /100 | #272 | Tragic 15.9% |
| Haitians | 0.0 /100 | #273 | Tragic 15.9% |
| Barbadians | 0.0 /100 | #274 | Tragic 15.9% |
| Immigrants | Barbados | 0.0 /100 | #275 | Tragic 16.0% |
| Central Americans | 0.0 /100 | #276 | Tragic 16.0% |
| Bangladeshis | 0.0 /100 | #277 | Tragic 16.0% |
| Immigrants | West Indies | 0.0 /100 | #278 | Tragic 16.1% |
| Immigrants | Bahamas | 0.0 /100 | #279 | Tragic 16.1% |
| Vietnamese | 0.0 /100 | #280 | Tragic 16.1% |
| West Indians | 0.0 /100 | #281 | Tragic 16.1% |
| Immigrants | Haiti | 0.0 /100 | #282 | Tragic 16.1% |
| Immigrants | Cuba | 0.0 /100 | #283 | Tragic 16.1% |
Demographics Similar to Paiute by Female Poverty
In terms of female poverty, the demographic groups most similar to Paiute are Immigrants from Honduras (17.7%, a difference of 0.18%), Colville (17.8%, a difference of 0.34%), Menominee (17.6%, a difference of 0.59%), Arapaho (17.5%, a difference of 1.3%), and Immigrants from Dominica (17.5%, a difference of 1.3%).
| Demographics | Rating | Rank | Female Poverty |
| Hondurans | 0.0 /100 | #316 | Tragic 17.4% |
| Immigrants | Congo | 0.0 /100 | #317 | Tragic 17.4% |
| Ute | 0.0 /100 | #318 | Tragic 17.5% |
| Cajuns | 0.0 /100 | #319 | Tragic 17.5% |
| Immigrants | Dominica | 0.0 /100 | #320 | Tragic 17.5% |
| Arapaho | 0.0 /100 | #321 | Tragic 17.5% |
| Menominee | 0.0 /100 | #322 | Tragic 17.6% |
| Paiute | 0.0 /100 | #323 | Tragic 17.7% |
| Immigrants | Honduras | 0.0 /100 | #324 | Tragic 17.7% |
| Colville | 0.0 /100 | #325 | Tragic 17.8% |
| Central American Indians | 0.0 /100 | #326 | Tragic 18.0% |
| Yakama | 0.0 /100 | #327 | Tragic 18.0% |
| Blacks/African Americans | 0.0 /100 | #328 | Tragic 18.6% |
| Kiowa | 0.0 /100 | #329 | Tragic 18.6% |
| Dominicans | 0.0 /100 | #330 | Tragic 19.1% |