Central American vs Immigrants from South America Child Poverty Among Girls Under 16
COMPARE
Central American
Immigrants from South America
Child Poverty Among Girls Under 16
Child Poverty Among Girls Under 16 Comparison
Central Americans
Immigrants from South America
20.2%
CHILD POVERTY AMONG GIRLS UNDER 16
0.0/ 100
METRIC RATING
281st/ 347
METRIC RANK
16.4%
CHILD POVERTY AMONG GIRLS UNDER 16
55.1/ 100
METRIC RATING
173rd/ 347
METRIC RANK
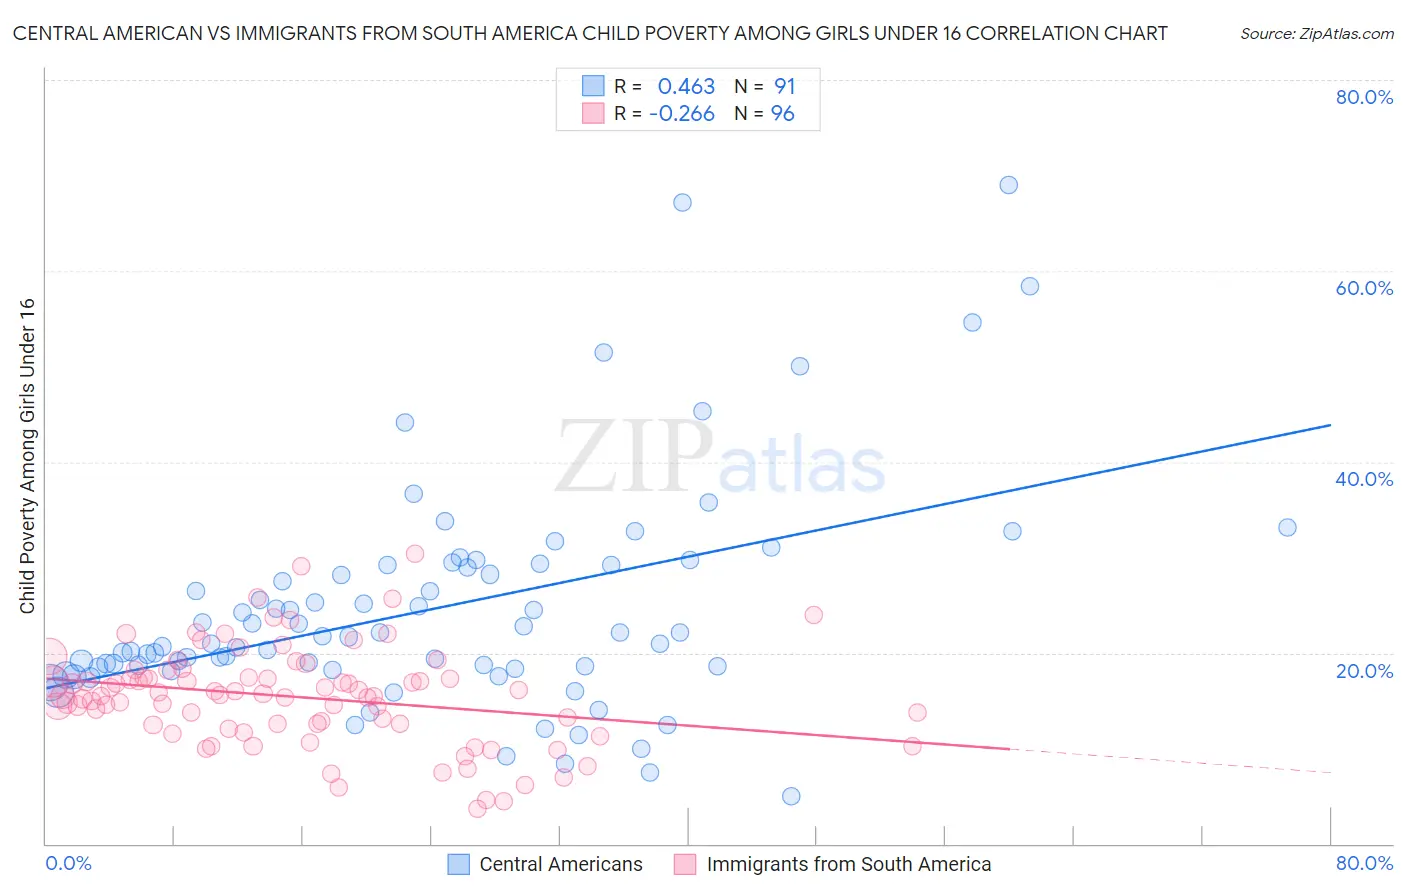
Central American vs Immigrants from South America Child Poverty Among Girls Under 16 Correlation Chart
The statistical analysis conducted on geographies consisting of 492,924,631 people shows a moderate positive correlation between the proportion of Central Americans and poverty level among girls under the age of 16 in the United States with a correlation coefficient (R) of 0.463 and weighted average of 20.2%. Similarly, the statistical analysis conducted on geographies consisting of 473,703,980 people shows a weak negative correlation between the proportion of Immigrants from South America and poverty level among girls under the age of 16 in the United States with a correlation coefficient (R) of -0.266 and weighted average of 16.4%, a difference of 23.7%.
Child Poverty Among Girls Under 16 Correlation Summary
| Measurement | Central American | Immigrants from South America |
| Minimum | 4.9% | 3.7% |
| Maximum | 69.0% | 30.3% |
| Range | 64.1% | 26.7% |
| Mean | 24.6% | 15.4% |
| Median | 21.7% | 15.5% |
| Interquartile 25% (IQ1) | 18.5% | 12.5% |
| Interquartile 75% (IQ3) | 29.2% | 17.4% |
| Interquartile Range (IQR) | 10.7% | 4.9% |
| Standard Deviation (Sample) | 11.7% | 5.2% |
| Standard Deviation (Population) | 11.7% | 5.1% |
Similar Demographics by Child Poverty Among Girls Under 16
Demographics Similar to Central Americans by Child Poverty Among Girls Under 16
In terms of child poverty among girls under 16, the demographic groups most similar to Central Americans are Immigrants from Liberia (20.2%, a difference of 0.070%), Immigrants from Zaire (20.2%, a difference of 0.080%), Barbadian (20.2%, a difference of 0.21%), Belizean (20.2%, a difference of 0.24%), and West Indian (20.3%, a difference of 0.28%).
| Demographics | Rating | Rank | Child Poverty Among Girls Under 16 |
| Immigrants | St. Vincent and the Grenadines | 0.0 /100 | #274 | Tragic 20.1% |
| Sub-Saharan Africans | 0.0 /100 | #275 | Tragic 20.1% |
| Comanche | 0.0 /100 | #276 | Tragic 20.2% |
| Belizeans | 0.0 /100 | #277 | Tragic 20.2% |
| Barbadians | 0.0 /100 | #278 | Tragic 20.2% |
| Immigrants | Zaire | 0.0 /100 | #279 | Tragic 20.2% |
| Immigrants | Liberia | 0.0 /100 | #280 | Tragic 20.2% |
| Central Americans | 0.0 /100 | #281 | Tragic 20.2% |
| West Indians | 0.0 /100 | #282 | Tragic 20.3% |
| Senegalese | 0.0 /100 | #283 | Tragic 20.3% |
| Yaqui | 0.0 /100 | #284 | Tragic 20.3% |
| Immigrants | Cabo Verde | 0.0 /100 | #285 | Tragic 20.3% |
| Iroquois | 0.0 /100 | #286 | Tragic 20.4% |
| Blackfeet | 0.0 /100 | #287 | Tragic 20.5% |
| Haitians | 0.0 /100 | #288 | Tragic 20.5% |
Demographics Similar to Immigrants from South America by Child Poverty Among Girls Under 16
In terms of child poverty among girls under 16, the demographic groups most similar to Immigrants from South America are Ethiopian (16.5%, a difference of 0.59%), Afghan (16.2%, a difference of 0.88%), Immigrants from Saudi Arabia (16.2%, a difference of 1.1%), Costa Rican (16.2%, a difference of 1.1%), and Immigrants from Venezuela (16.2%, a difference of 1.1%).
| Demographics | Rating | Rank | Child Poverty Among Girls Under 16 |
| South Americans | 67.2 /100 | #166 | Good 16.1% |
| Uruguayans | 64.7 /100 | #167 | Good 16.2% |
| Yugoslavians | 64.4 /100 | #168 | Good 16.2% |
| Costa Ricans | 64.2 /100 | #169 | Good 16.2% |
| Immigrants | Venezuela | 64.2 /100 | #170 | Good 16.2% |
| Immigrants | Saudi Arabia | 64.0 /100 | #171 | Good 16.2% |
| Afghans | 62.3 /100 | #172 | Good 16.2% |
| Immigrants | South America | 55.1 /100 | #173 | Average 16.4% |
| Ethiopians | 50.0 /100 | #174 | Average 16.5% |
| Lebanese | 45.4 /100 | #175 | Average 16.6% |
| Hungarians | 45.1 /100 | #176 | Average 16.6% |
| Immigrants | Western Asia | 44.1 /100 | #177 | Average 16.6% |
| Whites/Caucasians | 43.6 /100 | #178 | Average 16.6% |
| Hawaiians | 43.4 /100 | #179 | Average 16.6% |
| Immigrants | Syria | 43.3 /100 | #180 | Average 16.6% |