Celtic vs Immigrants from Belarus Family Poverty
COMPARE
Celtic
Immigrants from Belarus
Family Poverty
Family Poverty Comparison
Celtics
Immigrants from Belarus
8.8%
FAMILY POVERTY
64.9/ 100
METRIC RATING
164th/ 347
METRIC RANK
8.5%
FAMILY POVERTY
83.2/ 100
METRIC RATING
146th/ 347
METRIC RANK
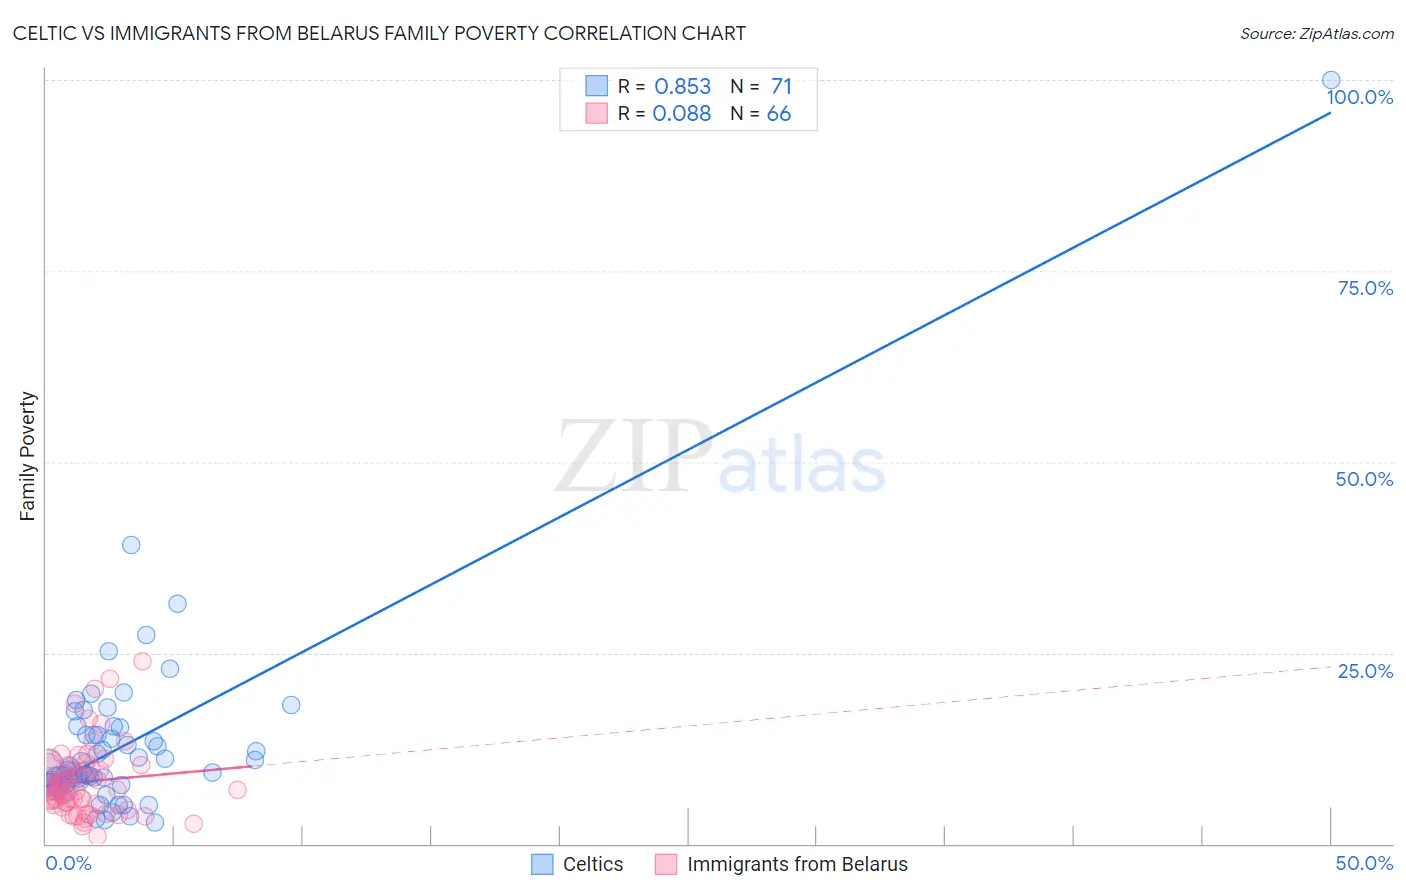
Celtic vs Immigrants from Belarus Family Poverty Correlation Chart
The statistical analysis conducted on geographies consisting of 168,628,915 people shows a very strong positive correlation between the proportion of Celtics and poverty level among families in the United States with a correlation coefficient (R) of 0.853 and weighted average of 8.8%. Similarly, the statistical analysis conducted on geographies consisting of 150,053,959 people shows a slight positive correlation between the proportion of Immigrants from Belarus and poverty level among families in the United States with a correlation coefficient (R) of 0.088 and weighted average of 8.5%, a difference of 3.4%.
Family Poverty Correlation Summary
| Measurement | Celtic | Immigrants from Belarus |
| Minimum | 2.8% | 1.0% |
| Maximum | 100.0% | 24.0% |
| Range | 97.2% | 22.9% |
| Mean | 12.7% | 8.1% |
| Median | 9.4% | 7.1% |
| Interquartile 25% (IQ1) | 7.6% | 5.3% |
| Interquartile 75% (IQ3) | 14.2% | 9.9% |
| Interquartile Range (IQR) | 6.6% | 4.7% |
| Standard Deviation (Sample) | 12.4% | 4.6% |
| Standard Deviation (Population) | 12.3% | 4.6% |
Demographics Similar to Celtics and Immigrants from Belarus by Family Poverty
In terms of family poverty, the demographic groups most similar to Celtics are Guamanian/Chamorro (8.8%, a difference of 0.030%), Pennsylvania German (8.8%, a difference of 0.16%), Ethiopian (8.8%, a difference of 0.21%), Immigrants from Northern Africa (8.8%, a difference of 0.30%), and Hungarian (8.8%, a difference of 0.34%). Similarly, the demographic groups most similar to Immigrants from Belarus are Immigrants from South Eastern Asia (8.5%, a difference of 0.010%), Immigrants from Jordan (8.5%, a difference of 0.030%), Scotch-Irish (8.6%, a difference of 0.24%), Mongolian (8.6%, a difference of 0.65%), and Syrian (8.6%, a difference of 0.65%).
| Demographics | Rating | Rank | Family Poverty |
| Immigrants | South Eastern Asia | 83.2 /100 | #145 | Excellent 8.5% |
| Immigrants | Belarus | 83.2 /100 | #146 | Excellent 8.5% |
| Immigrants | Jordan | 83.0 /100 | #147 | Excellent 8.5% |
| Scotch-Irish | 82.2 /100 | #148 | Excellent 8.6% |
| Mongolians | 80.4 /100 | #149 | Excellent 8.6% |
| Syrians | 80.3 /100 | #150 | Excellent 8.6% |
| Brazilians | 80.1 /100 | #151 | Excellent 8.6% |
| Samoans | 79.8 /100 | #152 | Good 8.6% |
| Immigrants | Spain | 79.1 /100 | #153 | Good 8.6% |
| Immigrants | Vietnam | 75.4 /100 | #154 | Good 8.7% |
| Immigrants | Kuwait | 73.6 /100 | #155 | Good 8.7% |
| Immigrants | Oceania | 71.2 /100 | #156 | Good 8.7% |
| Tsimshian | 69.3 /100 | #157 | Good 8.8% |
| Whites/Caucasians | 69.1 /100 | #158 | Good 8.8% |
| Peruvians | 68.0 /100 | #159 | Good 8.8% |
| Hungarians | 67.2 /100 | #160 | Good 8.8% |
| Immigrants | Northern Africa | 66.9 /100 | #161 | Good 8.8% |
| Ethiopians | 66.3 /100 | #162 | Good 8.8% |
| Pennsylvania Germans | 66.0 /100 | #163 | Good 8.8% |
| Celtics | 64.9 /100 | #164 | Good 8.8% |
| Guamanians/Chamorros | 64.7 /100 | #165 | Good 8.8% |