Canadian vs Immigrants from Cambodia Female Poverty
COMPARE
Canadian
Immigrants from Cambodia
Female Poverty
Female Poverty Comparison
Canadians
Immigrants from Cambodia
12.7%
FEMALE POVERTY
92.0/ 100
METRIC RATING
113th/ 347
METRIC RANK
14.5%
FEMALE POVERTY
3.7/ 100
METRIC RATING
221st/ 347
METRIC RANK
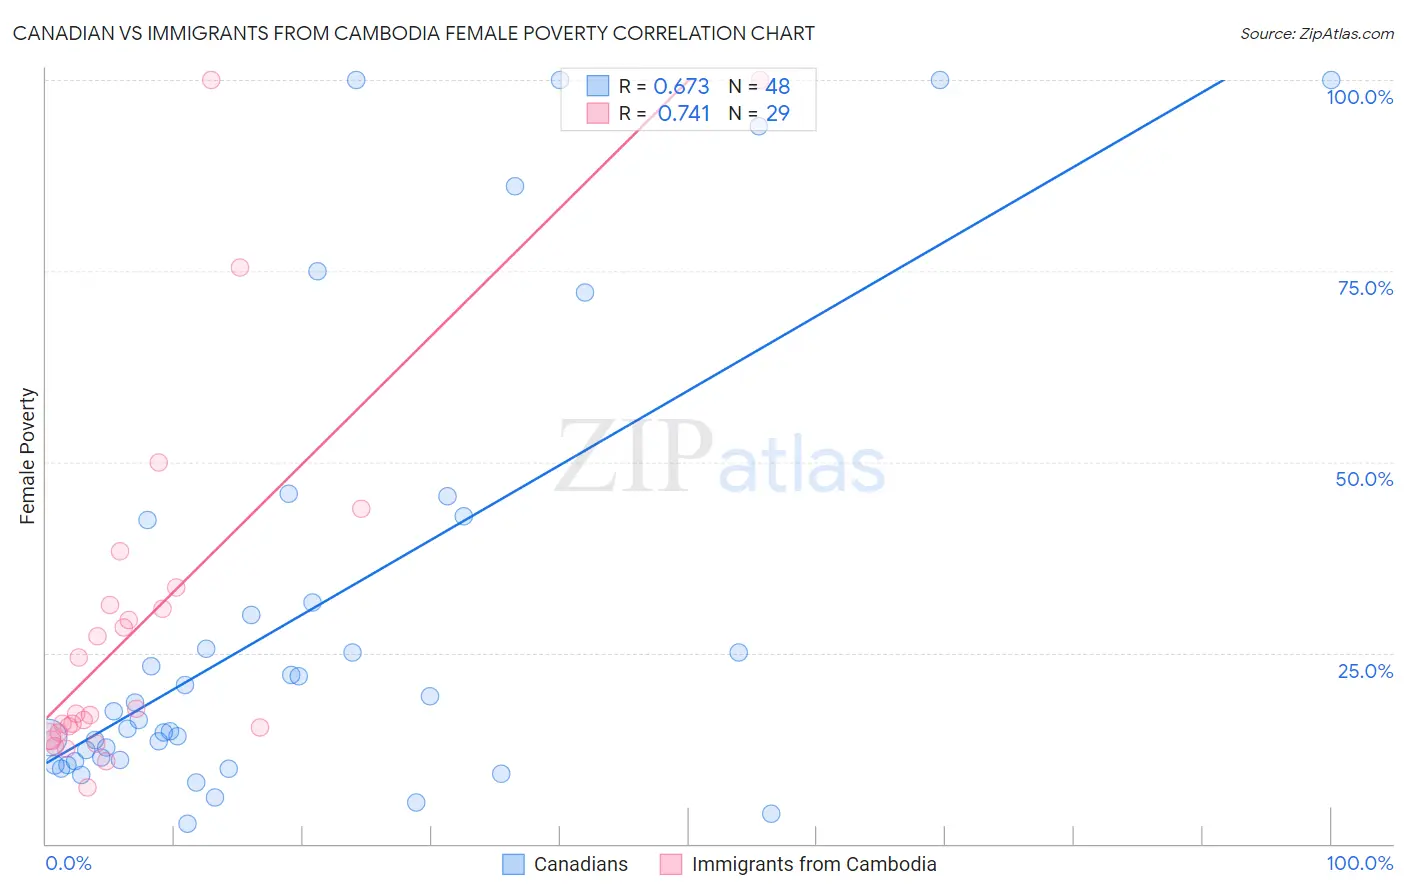
Canadian vs Immigrants from Cambodia Female Poverty Correlation Chart
The statistical analysis conducted on geographies consisting of 437,154,651 people shows a significant positive correlation between the proportion of Canadians and poverty level among females in the United States with a correlation coefficient (R) of 0.673 and weighted average of 12.7%. Similarly, the statistical analysis conducted on geographies consisting of 205,118,115 people shows a strong positive correlation between the proportion of Immigrants from Cambodia and poverty level among females in the United States with a correlation coefficient (R) of 0.741 and weighted average of 14.5%, a difference of 14.5%.
Female Poverty Correlation Summary
| Measurement | Canadian | Immigrants from Cambodia |
| Minimum | 2.7% | 7.4% |
| Maximum | 100.0% | 100.0% |
| Range | 97.3% | 92.6% |
| Mean | 30.0% | 29.0% |
| Median | 16.8% | 17.1% |
| Interquartile 25% (IQ1) | 10.9% | 14.3% |
| Interquartile 75% (IQ3) | 37.0% | 32.4% |
| Interquartile Range (IQR) | 26.0% | 18.0% |
| Standard Deviation (Sample) | 29.7% | 24.4% |
| Standard Deviation (Population) | 29.4% | 23.9% |
Similar Demographics by Female Poverty
Demographics Similar to Canadians by Female Poverty
In terms of female poverty, the demographic groups most similar to Canadians are Immigrants from Israel (12.6%, a difference of 0.030%), Welsh (12.7%, a difference of 0.12%), Puget Sound Salish (12.7%, a difference of 0.14%), Soviet Union (12.6%, a difference of 0.17%), and Immigrants from Russia (12.7%, a difference of 0.26%).
| Demographics | Rating | Rank | Female Poverty |
| Immigrants | Turkey | 93.8 /100 | #106 | Exceptional 12.6% |
| Laotians | 93.4 /100 | #107 | Exceptional 12.6% |
| Portuguese | 93.1 /100 | #108 | Exceptional 12.6% |
| Immigrants | Zimbabwe | 93.1 /100 | #109 | Exceptional 12.6% |
| Paraguayans | 93.0 /100 | #110 | Exceptional 12.6% |
| Soviet Union | 92.4 /100 | #111 | Exceptional 12.6% |
| Immigrants | Israel | 92.0 /100 | #112 | Exceptional 12.6% |
| Canadians | 92.0 /100 | #113 | Exceptional 12.7% |
| Welsh | 91.6 /100 | #114 | Exceptional 12.7% |
| Puget Sound Salish | 91.5 /100 | #115 | Exceptional 12.7% |
| Immigrants | Russia | 91.2 /100 | #116 | Exceptional 12.7% |
| Immigrants | Southern Europe | 90.9 /100 | #117 | Exceptional 12.7% |
| Sri Lankans | 90.9 /100 | #118 | Exceptional 12.7% |
| Albanians | 90.8 /100 | #119 | Exceptional 12.7% |
| New Zealanders | 90.6 /100 | #120 | Exceptional 12.7% |
Demographics Similar to Immigrants from Cambodia by Female Poverty
In terms of female poverty, the demographic groups most similar to Immigrants from Cambodia are Nonimmigrants (14.5%, a difference of 0.020%), Alsatian (14.5%, a difference of 0.19%), Japanese (14.5%, a difference of 0.24%), Immigrants from Africa (14.5%, a difference of 0.26%), and Immigrants from Uzbekistan (14.4%, a difference of 0.38%).
| Demographics | Rating | Rank | Female Poverty |
| Marshallese | 5.0 /100 | #214 | Tragic 14.4% |
| Immigrants | Panama | 4.7 /100 | #215 | Tragic 14.4% |
| Immigrants | Thailand | 4.5 /100 | #216 | Tragic 14.4% |
| Immigrants | Immigrants | 4.5 /100 | #217 | Tragic 14.4% |
| Immigrants | Uzbekistan | 4.4 /100 | #218 | Tragic 14.4% |
| Japanese | 4.1 /100 | #219 | Tragic 14.5% |
| Alsatians | 4.0 /100 | #220 | Tragic 14.5% |
| Immigrants | Cambodia | 3.7 /100 | #221 | Tragic 14.5% |
| Immigrants | Nonimmigrants | 3.7 /100 | #222 | Tragic 14.5% |
| Immigrants | Africa | 3.3 /100 | #223 | Tragic 14.5% |
| Americans | 2.8 /100 | #224 | Tragic 14.6% |
| Immigrants | Micronesia | 2.8 /100 | #225 | Tragic 14.6% |
| Immigrants | Eritrea | 2.4 /100 | #226 | Tragic 14.6% |
| Immigrants | Nigeria | 2.1 /100 | #227 | Tragic 14.7% |
| German Russians | 2.0 /100 | #228 | Tragic 14.7% |