Canadian vs Australian Female Poverty Among 18-24 Year Olds
COMPARE
Canadian
Australian
Female Poverty Among 18-24 Year Olds
Female Poverty Among 18-24 Year Olds Comparison
Canadians
Australians
19.7%
FEMALE POVERTY AMONG 18-24 YEAR OLDS
83.8/ 100
METRIC RATING
145th/ 347
METRIC RANK
20.8%
FEMALE POVERTY AMONG 18-24 YEAR OLDS
6.1/ 100
METRIC RATING
229th/ 347
METRIC RANK
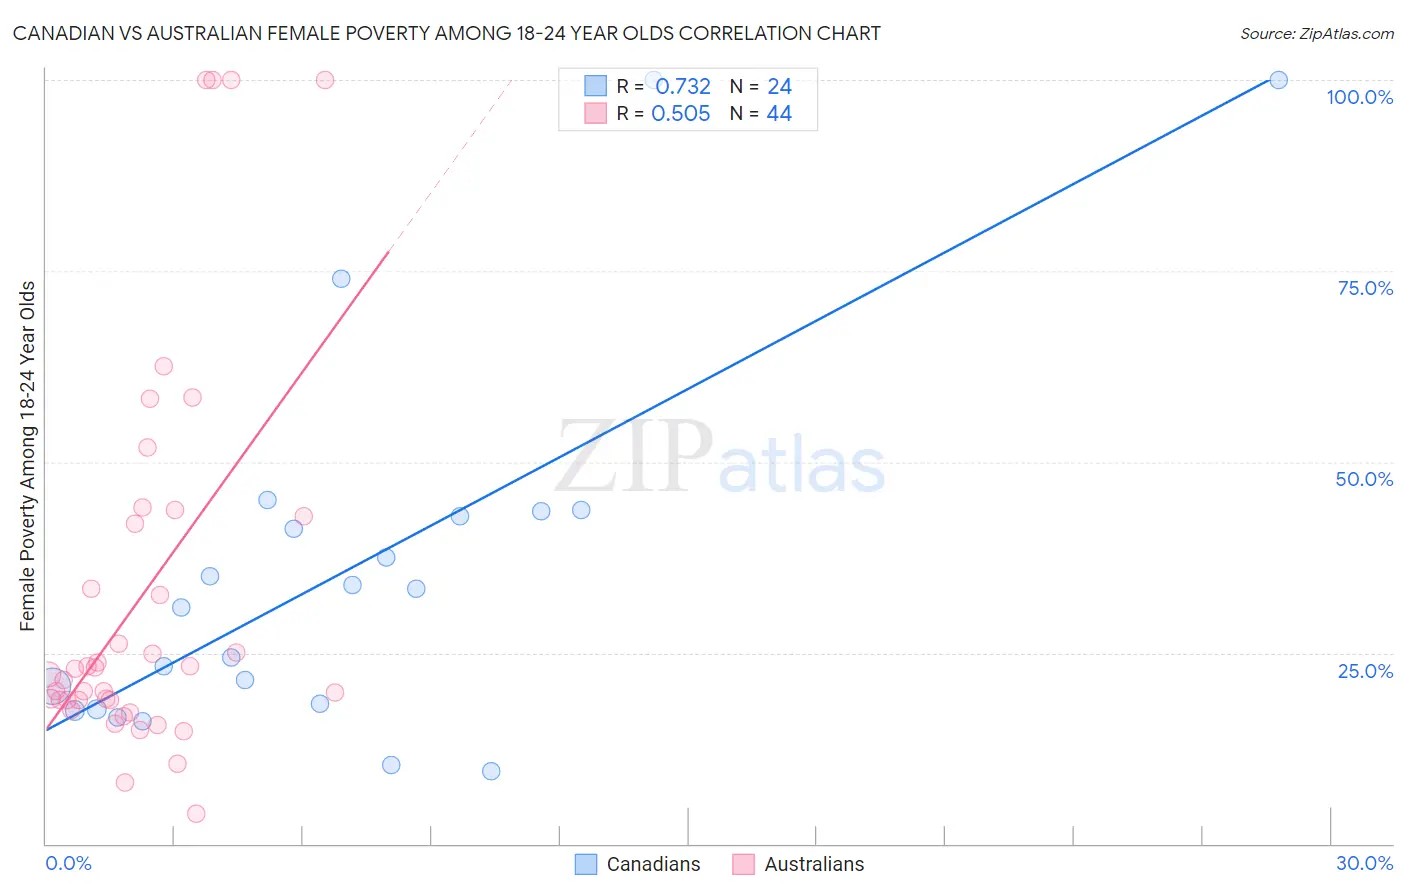
Canadian vs Australian Female Poverty Among 18-24 Year Olds Correlation Chart
The statistical analysis conducted on geographies consisting of 422,696,496 people shows a strong positive correlation between the proportion of Canadians and poverty level among females between the ages 18 and 24 in the United States with a correlation coefficient (R) of 0.732 and weighted average of 19.7%. Similarly, the statistical analysis conducted on geographies consisting of 220,959,335 people shows a substantial positive correlation between the proportion of Australians and poverty level among females between the ages 18 and 24 in the United States with a correlation coefficient (R) of 0.505 and weighted average of 20.8%, a difference of 5.4%.
Female Poverty Among 18-24 Year Olds Correlation Summary
| Measurement | Canadian | Australian |
| Minimum | 9.5% | 4.0% |
| Maximum | 100.0% | 100.0% |
| Range | 90.5% | 96.0% |
| Mean | 35.7% | 32.6% |
| Median | 32.2% | 22.6% |
| Interquartile 25% (IQ1) | 17.9% | 18.8% |
| Interquartile 75% (IQ3) | 43.2% | 42.4% |
| Interquartile Range (IQR) | 25.3% | 23.6% |
| Standard Deviation (Sample) | 24.5% | 25.4% |
| Standard Deviation (Population) | 24.0% | 25.1% |
Similar Demographics by Female Poverty Among 18-24 Year Olds
Demographics Similar to Canadians by Female Poverty Among 18-24 Year Olds
In terms of female poverty among 18-24 year olds, the demographic groups most similar to Canadians are Immigrants from Bosnia and Herzegovina (19.7%, a difference of 0.020%), Immigrants from Northern Africa (19.7%, a difference of 0.030%), Slavic (19.7%, a difference of 0.060%), Immigrants from Austria (19.7%, a difference of 0.060%), and Panamanian (19.7%, a difference of 0.070%).
| Demographics | Rating | Rank | Female Poverty Among 18-24 Year Olds |
| Immigrants | Morocco | 89.9 /100 | #138 | Excellent 19.6% |
| Indians (Asian) | 88.3 /100 | #139 | Excellent 19.6% |
| Immigrants | Trinidad and Tobago | 85.6 /100 | #140 | Excellent 19.7% |
| Pennsylvania Germans | 85.5 /100 | #141 | Excellent 19.7% |
| Panamanians | 84.6 /100 | #142 | Excellent 19.7% |
| Slavs | 84.4 /100 | #143 | Excellent 19.7% |
| Immigrants | Northern Africa | 84.1 /100 | #144 | Excellent 19.7% |
| Canadians | 83.8 /100 | #145 | Excellent 19.7% |
| Immigrants | Bosnia and Herzegovina | 83.6 /100 | #146 | Excellent 19.7% |
| Immigrants | Austria | 83.1 /100 | #147 | Excellent 19.7% |
| Immigrants | Latin America | 81.3 /100 | #148 | Excellent 19.7% |
| Immigrants | Oceania | 81.2 /100 | #149 | Excellent 19.7% |
| Syrians | 80.2 /100 | #150 | Excellent 19.8% |
| Immigrants | Eastern Asia | 79.7 /100 | #151 | Good 19.8% |
| Yugoslavians | 79.0 /100 | #152 | Good 19.8% |
Demographics Similar to Australians by Female Poverty Among 18-24 Year Olds
In terms of female poverty among 18-24 year olds, the demographic groups most similar to Australians are White/Caucasian (20.8%, a difference of 0.0%), Immigrants from St. Vincent and the Grenadines (20.8%, a difference of 0.030%), Finnish (20.8%, a difference of 0.030%), Immigrants from Denmark (20.8%, a difference of 0.060%), and Ghanaian (20.8%, a difference of 0.070%).
| Demographics | Rating | Rank | Female Poverty Among 18-24 Year Olds |
| Guatemalans | 8.1 /100 | #222 | Tragic 20.7% |
| French | 7.9 /100 | #223 | Tragic 20.7% |
| Immigrants | Liberia | 7.6 /100 | #224 | Tragic 20.7% |
| Norwegians | 7.3 /100 | #225 | Tragic 20.7% |
| Estonians | 7.2 /100 | #226 | Tragic 20.7% |
| Immigrants | Sweden | 6.8 /100 | #227 | Tragic 20.7% |
| Ghanaians | 6.5 /100 | #228 | Tragic 20.8% |
| Australians | 6.1 /100 | #229 | Tragic 20.8% |
| Whites/Caucasians | 6.1 /100 | #230 | Tragic 20.8% |
| Immigrants | St. Vincent and the Grenadines | 6.0 /100 | #231 | Tragic 20.8% |
| Finns | 6.0 /100 | #232 | Tragic 20.8% |
| Immigrants | Denmark | 5.8 /100 | #233 | Tragic 20.8% |
| Welsh | 5.4 /100 | #234 | Tragic 20.8% |
| Immigrants | Uganda | 5.1 /100 | #235 | Tragic 20.8% |
| Okinawans | 4.9 /100 | #236 | Tragic 20.8% |