Burmese vs Bulgarian Receiving Food Stamps

COMPARE

Burmese
Race
Ancestry
AfghanAfricanAlaska NativeAlaskan AthabascanAlbanianAleutAlsatianAmericanApacheArabArapahoArgentineanArmenianAssyrian/Chaldean/SyriacAustralianAustrianBahamianBangladeshiBarbadianBasqueBelgianBelizeanBermudanBhutaneseBlackfeetBolivianBrazilianBritishBritish West IndianBurmeseCajunCambodianCanadianCape VerdeanCarpatho RusynCelticCentral AmericanCentral American IndianCherokeeCheyenneChickasawChileanChineseChippewaChoctawColombianColvilleComancheCosta RicanCreeCreekCroatianCrowCubanCypriotCzechCzechoslovakianDanishDelawareDominicanDutchDutch West IndianEastern EuropeanEcuadorianEgyptianEnglishEstonianEthiopianEuropeanFijianFilipinoFinnishFrenchFrench American IndianFrench CanadianGermanGerman RussianGhanaianGreekGuamanian/ChamorroGuatemalanGuyaneseHaitianHmongHonduranHopiHoumaHungarianIcelanderIndian (Asian)IndonesianInupiatIranianIraqiIrishIroquoisIsraeliItalianJamaicanJapaneseJordanianKenyanKiowaKoreanLaotianLatvianLebaneseLiberianLithuanianLumbeeLuxembourgerMacedonianMalaysianMalteseMarshalleseMenomineeMexicanMexican American IndianMongolianMoroccanNative HawaiianNavajoNepaleseNew ZealanderNicaraguanNigerianNorthern EuropeanNorwegianOkinawanOsageOttawaPaiutePakistaniPalestinianPanamanianParaguayanPennsylvania GermanPeruvianPimaPolishPortuguesePotawatomiPuebloPuerto RicanPuget Sound SalishRomanianRussianSalvadoranSamoanScandinavianScotch-IrishScottishSeminoleSenegaleseSerbianShoshoneSierra LeoneanSiouxSlavicSlovakSloveneSomaliSouth AfricanSouth AmericanSouth American IndianSoviet UnionSpaniardSpanishSpanish AmericanSpanish American IndianSri LankanSubsaharan AfricanSudaneseSwedishSwissSyrianTaiwaneseThaiTlingit-HaidaTohono O'OdhamTonganTrinidadian and TobagonianTsimshianTurkishU.S. Virgin IslanderUgandanUkrainianUruguayanUteVenezuelanVietnameseWelshWest IndianYakamaYaquiYugoslavianYumanYup'ikZimbabwean
Immigration
NonimmigrantsImmigrantsAfghanistanAfricaAlbaniaArgentinaArmeniaAsiaAustraliaAustriaBahamasBangladeshBarbadosBelarusBelgiumBelizeBoliviaBosnia and HerzegovinaBrazilBulgariaBurma/MyanmarCabo VerdeCambodiaCameroonCanadaCaribbeanCentral AmericaChileChinaColombiaCongoCosta RicaCroatiaCubaCzechoslovakiaDenmarkDominicaDominican RepublicEastern AfricaEastern AsiaEastern EuropeEcuadorEgyptEl SalvadorEnglandEritreaEthiopiaEuropeFijiFranceGermanyGhanaGreeceGrenadaGuatemalaGuyanaHaitiHondurasHong KongHungaryIndiaIndonesiaIranIraqIrelandIsraelItalyJamaicaJapanJordanKazakhstanKenyaKoreaKuwaitLaosLatin AmericaLatviaLebanonLiberiaLithuaniaMalaysiaMexicoMicronesiaMiddle AfricaMoldovaMoroccoNepalNetherlandsNicaraguaNigeriaNorth AmericaNorth MacedoniaNorthern AfricaNorthern EuropeNorwayOceaniaPakistanPanamaPeruPhilippinesPolandPortugalRomaniaRussiaSaudi ArabiaScotlandSenegalSerbiaSierra LeoneSingaporeSomaliaSouth AfricaSouth AmericaSouth Central AsiaSouth Eastern AsiaSouthern EuropeSpainSri LankaSt. Vincent and the GrenadinesSudanSwedenSwitzerlandSyriaTaiwanThailandTrinidad and TobagoTurkeyUgandaUkraineUruguayUzbekistanVenezuelaVietnamWest IndiesWestern AfricaWestern AsiaWestern EuropeYemenZaireZimbabweAzores
Bulgarian
Race
Ancestry
AfghanAfricanAlaska NativeAlaskan AthabascanAlbanianAleutAlsatianAmericanApacheArabArapahoArgentineanArmenianAssyrian/Chaldean/SyriacAustralianAustrianBahamianBangladeshiBarbadianBasqueBelgianBelizeanBermudanBhutaneseBlackfeetBolivianBrazilianBritishBritish West IndianBulgarianCajunCambodianCanadianCape VerdeanCarpatho RusynCelticCentral AmericanCentral American IndianCherokeeCheyenneChickasawChileanChineseChippewaChoctawColombianColvilleComancheCosta RicanCreeCreekCroatianCrowCubanCypriotCzechCzechoslovakianDanishDelawareDominicanDutchDutch West IndianEastern EuropeanEcuadorianEgyptianEnglishEstonianEthiopianEuropeanFijianFilipinoFinnishFrenchFrench American IndianFrench CanadianGermanGerman RussianGhanaianGreekGuamanian/ChamorroGuatemalanGuyaneseHaitianHmongHonduranHopiHoumaHungarianIcelanderIndian (Asian)IndonesianInupiatIranianIraqiIrishIroquoisIsraeliItalianJamaicanJapaneseJordanianKenyanKiowaKoreanLaotianLatvianLebaneseLiberianLithuanianLumbeeLuxembourgerMacedonianMalaysianMalteseMarshalleseMenomineeMexicanMexican American IndianMongolianMoroccanNative HawaiianNavajoNepaleseNew ZealanderNicaraguanNigerianNorthern EuropeanNorwegianOkinawanOsageOttawaPaiutePakistaniPalestinianPanamanianParaguayanPennsylvania GermanPeruvianPimaPolishPortuguesePotawatomiPuebloPuerto RicanPuget Sound SalishRomanianRussianSalvadoranSamoanScandinavianScotch-IrishScottishSeminoleSenegaleseSerbianShoshoneSierra LeoneanSiouxSlavicSlovakSloveneSomaliSouth AfricanSouth AmericanSouth American IndianSoviet UnionSpaniardSpanishSpanish AmericanSpanish American IndianSri LankanSubsaharan AfricanSudaneseSwedishSwissSyrianTaiwaneseThaiTlingit-HaidaTohono O'OdhamTonganTrinidadian and TobagonianTsimshianTurkishU.S. Virgin IslanderUgandanUkrainianUruguayanUteVenezuelanVietnameseWelshWest IndianYakamaYaquiYugoslavianYumanYup'ikZimbabwean
Immigration
NonimmigrantsImmigrantsAfghanistanAfricaAlbaniaArgentinaArmeniaAsiaAustraliaAustriaBahamasBangladeshBarbadosBelarusBelgiumBelizeBoliviaBosnia and HerzegovinaBrazilBulgariaBurma/MyanmarCabo VerdeCambodiaCameroonCanadaCaribbeanCentral AmericaChileChinaColombiaCongoCosta RicaCroatiaCubaCzechoslovakiaDenmarkDominicaDominican RepublicEastern AfricaEastern AsiaEastern EuropeEcuadorEgyptEl SalvadorEnglandEritreaEthiopiaEuropeFijiFranceGermanyGhanaGreeceGrenadaGuatemalaGuyanaHaitiHondurasHong KongHungaryIndiaIndonesiaIranIraqIrelandIsraelItalyJamaicaJapanJordanKazakhstanKenyaKoreaKuwaitLaosLatin AmericaLatviaLebanonLiberiaLithuaniaMalaysiaMexicoMicronesiaMiddle AfricaMoldovaMoroccoNepalNetherlandsNicaraguaNigeriaNorth AmericaNorth MacedoniaNorthern AfricaNorthern EuropeNorwayOceaniaPakistanPanamaPeruPhilippinesPolandPortugalRomaniaRussiaSaudi ArabiaScotlandSenegalSerbiaSierra LeoneSingaporeSomaliaSouth AfricaSouth AmericaSouth Central AsiaSouth Eastern AsiaSouthern EuropeSpainSri LankaSt. Vincent and the GrenadinesSudanSwedenSwitzerlandSyriaTaiwanThailandTrinidad and TobagoTurkeyUgandaUkraineUruguayUzbekistanVenezuelaVietnamWest IndiesWestern AfricaWestern AsiaWestern EuropeYemenZaireZimbabweAzores
Receiving Food Stamps
Income
Poverty
Unemployment
Labor Participation
Family Structure
Vehicle Availability
Education Level
Disability

Receiving Food Stamps Comparison

Burmese

Bulgarians

Exceptional
Exceptional
8.6%
RECEIVING FOOD STAMPS
99.9/ 100
METRIC RATING
8th/ 347
METRIC RANK
8.9%
RECEIVING FOOD STAMPS
99.9/ 100
METRIC RATING
13th/ 347
METRIC RANK

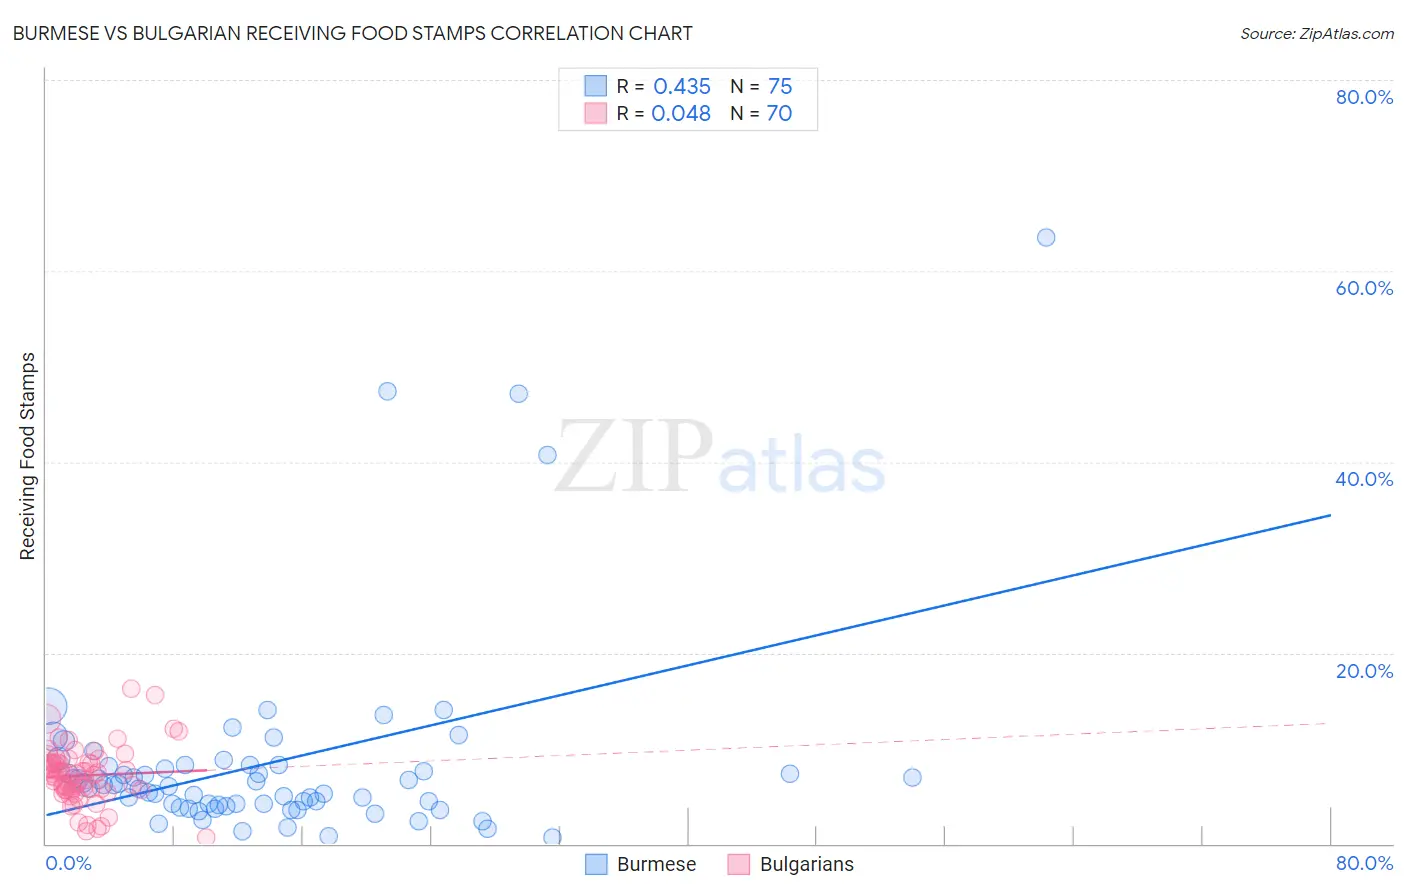
Burmese vs Bulgarian Receiving Food Stamps Correlation Chart

The statistical analysis conducted on geographies consisting of 463,413,617 people shows a moderate positive correlation between the proportion of Burmese and percentage of population receiving government assistance and/or food stamps in the United States with a correlation coefficient (R) of 0.435 and weighted average of 8.6%. Similarly, the statistical analysis conducted on geographies consisting of 205,325,342 people shows no correlation between the proportion of Bulgarians and percentage of population receiving government assistance and/or food stamps in the United States with a correlation coefficient (R) of 0.048 and weighted average of 8.9%, a difference of 2.8%.
Burmese vs Bulgarian Receiving Food Stamps

Receiving Food Stamps Correlation Summary

MeasurementBurmeseBulgarian
Minimum0.70%0.60%
Maximum63.5%16.3%
Range62.8%15.7%
Mean8.5%7.2%
Median6.1%7.2%
Interquartile 25% (IQ1)4.1%5.7%
Interquartile 75% (IQ3)8.3%8.5%
Interquartile Range (IQR)4.2%2.8%
Standard Deviation (Sample)10.5%3.0%
Standard Deviation (Population)10.4%3.0%

Demographics Similar to Burmese and Bulgarians by Receiving Food Stamps

In terms of receiving food stamps, the demographic groups most similar to Burmese are Immigrants from Korea (8.7%, a difference of 0.16%), Immigrants from South Central Asia (8.8%, a difference of 2.1%), Okinawan (8.9%, a difference of 2.5%), Cypriot (8.9%, a difference of 2.6%), and Maltese (8.9%, a difference of 2.9%). Similarly, the demographic groups most similar to Bulgarians are Maltese (8.9%, a difference of 0.13%), Cypriot (8.9%, a difference of 0.19%), Okinawan (8.9%, a difference of 0.20%), Immigrants from South Central Asia (8.8%, a difference of 0.63%), and Norwegian (9.0%, a difference of 0.79%).
DemographicsRating | RankReceiving Food Stamps
Immigrants | Taiwan
100.0
/100
|
#1
Exceptional
7.3%
Immigrants | India
100.0
/100
|
#2
Exceptional
7.4%
Filipinos
100.0
/100
|
#3
Exceptional
7.4%
Iranians
100.0
/100
|
#4
Exceptional
7.9%
Thais
100.0
/100
|
#5
Exceptional
8.1%
Immigrants | Singapore
100.0
/100
|
#6
Exceptional
8.3%
Immigrants | Iran
100.0
/100
|
#7
Exceptional
8.3%
Burmese
99.9
/100
|
#8
Exceptional
8.6%
Immigrants | Korea
99.9
/100
|
#9
Exceptional
8.7%
Immigrants | South Central Asia
99.9
/100
|
#10
Exceptional
8.8%
Okinawans
99.9
/100
|
#11
Exceptional
8.9%
Cypriots
99.9
/100
|
#12
Exceptional
8.9%
Bulgarians
99.9
/100
|
#13
Exceptional
8.9%
Maltese
99.9
/100
|
#14
Exceptional
8.9%
Norwegians
99.9
/100
|
#15
Exceptional
9.0%
Immigrants | Japan
99.9
/100
|
#16
Exceptional
9.0%
Immigrants | Scotland
99.9
/100
|
#17
Exceptional
9.0%
Danes
99.9
/100
|
#18
Exceptional
9.0%
Immigrants | Hong Kong
99.8
/100
|
#19
Exceptional
9.1%
Latvians
99.8
/100
|
#20
Exceptional
9.1%