Bulgarian vs Cherokee Female Poverty
COMPARE
Bulgarian
Cherokee
Female Poverty
Female Poverty Comparison
Bulgarians
Cherokee
11.1%
FEMALE POVERTY
99.9/ 100
METRIC RATING
9th/ 347
METRIC RANK
15.6%
FEMALE POVERTY
0.1/ 100
METRIC RATING
263rd/ 347
METRIC RANK
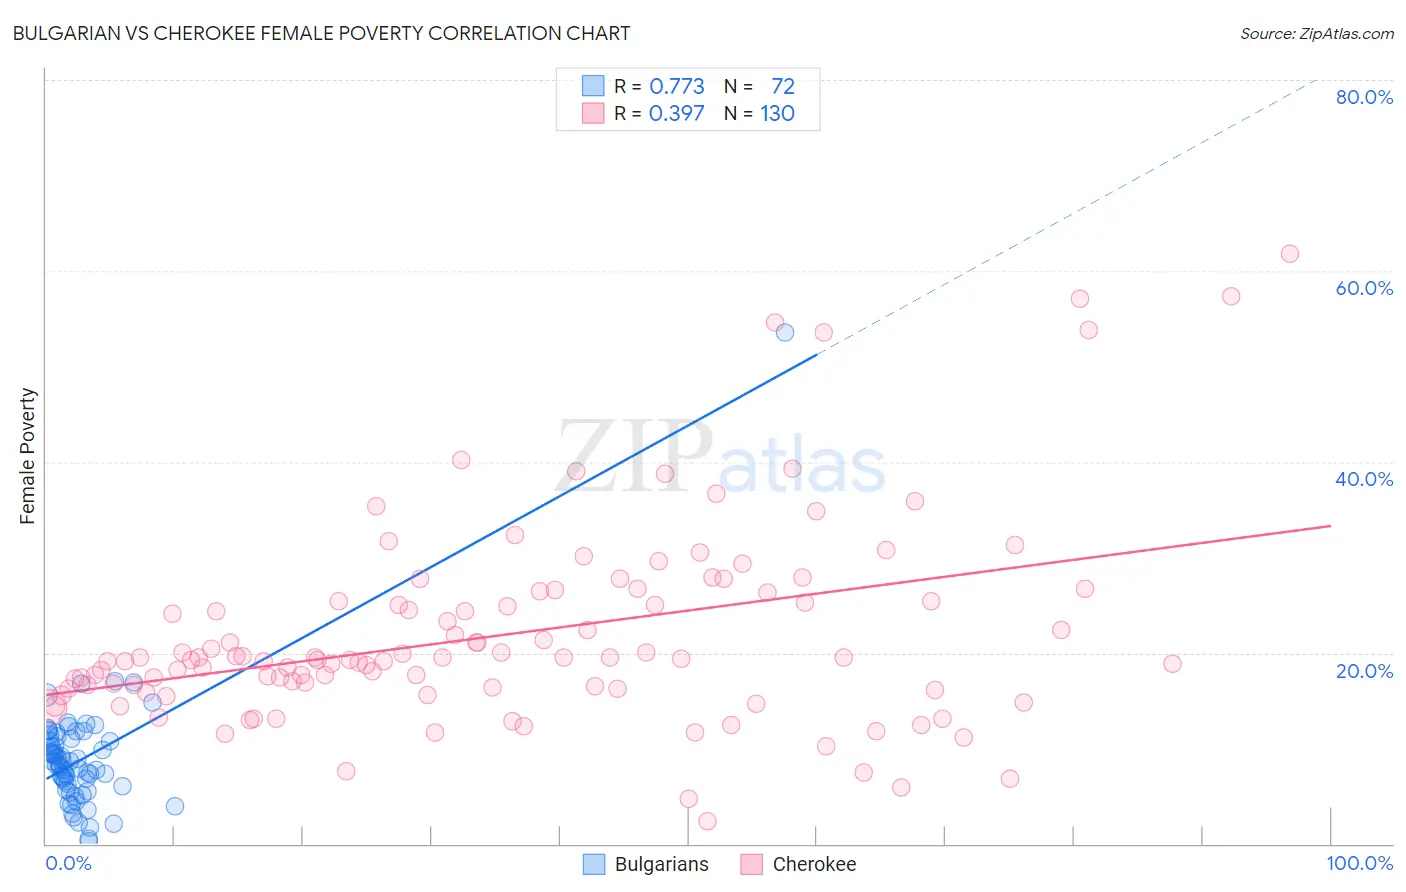
Bulgarian vs Cherokee Female Poverty Correlation Chart
The statistical analysis conducted on geographies consisting of 205,544,553 people shows a strong positive correlation between the proportion of Bulgarians and poverty level among females in the United States with a correlation coefficient (R) of 0.773 and weighted average of 11.1%. Similarly, the statistical analysis conducted on geographies consisting of 493,220,722 people shows a mild positive correlation between the proportion of Cherokee and poverty level among females in the United States with a correlation coefficient (R) of 0.397 and weighted average of 15.6%, a difference of 40.2%.
Female Poverty Correlation Summary
| Measurement | Bulgarian | Cherokee |
| Minimum | 0.25% | 2.3% |
| Maximum | 53.6% | 61.8% |
| Range | 53.3% | 59.5% |
| Mean | 9.0% | 21.9% |
| Median | 8.5% | 19.3% |
| Interquartile 25% (IQ1) | 6.2% | 16.3% |
| Interquartile 75% (IQ3) | 11.1% | 25.5% |
| Interquartile Range (IQR) | 4.9% | 9.2% |
| Standard Deviation (Sample) | 6.5% | 10.5% |
| Standard Deviation (Population) | 6.4% | 10.5% |
Similar Demographics by Female Poverty
Demographics Similar to Bulgarians by Female Poverty
In terms of female poverty, the demographic groups most similar to Bulgarians are Immigrants from South Central Asia (11.1%, a difference of 0.19%), Immigrants from Hong Kong (11.2%, a difference of 0.80%), Assyrian/Chaldean/Syriac (11.0%, a difference of 0.89%), Maltese (11.2%, a difference of 0.91%), and Immigrants from Ireland (11.0%, a difference of 1.3%).
| Demographics | Rating | Rank | Female Poverty |
| Chinese | 100.0 /100 | #2 | Exceptional 10.4% |
| Thais | 100.0 /100 | #3 | Exceptional 10.5% |
| Immigrants | Taiwan | 100.0 /100 | #4 | Exceptional 10.5% |
| Filipinos | 100.0 /100 | #5 | Exceptional 10.9% |
| Immigrants | Ireland | 99.9 /100 | #6 | Exceptional 11.0% |
| Assyrians/Chaldeans/Syriacs | 99.9 /100 | #7 | Exceptional 11.0% |
| Immigrants | South Central Asia | 99.9 /100 | #8 | Exceptional 11.1% |
| Bulgarians | 99.9 /100 | #9 | Exceptional 11.1% |
| Immigrants | Hong Kong | 99.9 /100 | #10 | Exceptional 11.2% |
| Maltese | 99.9 /100 | #11 | Exceptional 11.2% |
| Bhutanese | 99.9 /100 | #12 | Exceptional 11.3% |
| Immigrants | Lithuania | 99.9 /100 | #13 | Exceptional 11.3% |
| Lithuanians | 99.8 /100 | #14 | Exceptional 11.4% |
| Latvians | 99.8 /100 | #15 | Exceptional 11.4% |
| Immigrants | Bolivia | 99.8 /100 | #16 | Exceptional 11.5% |
Demographics Similar to Cherokee by Female Poverty
In terms of female poverty, the demographic groups most similar to Cherokee are Guyanese (15.6%, a difference of 0.010%), Mexican American Indian (15.6%, a difference of 0.010%), Immigrants from Guyana (15.6%, a difference of 0.11%), Immigrants from Ecuador (15.6%, a difference of 0.13%), and Cape Verdean (15.6%, a difference of 0.19%).
| Demographics | Rating | Rank | Female Poverty |
| Jamaicans | 0.2 /100 | #256 | Tragic 15.5% |
| Immigrants | Jamaica | 0.1 /100 | #257 | Tragic 15.6% |
| Shoshone | 0.1 /100 | #258 | Tragic 15.6% |
| Cape Verdeans | 0.1 /100 | #259 | Tragic 15.6% |
| Immigrants | Guyana | 0.1 /100 | #260 | Tragic 15.6% |
| Guyanese | 0.1 /100 | #261 | Tragic 15.6% |
| Mexican American Indians | 0.1 /100 | #262 | Tragic 15.6% |
| Cherokee | 0.1 /100 | #263 | Tragic 15.6% |
| Immigrants | Ecuador | 0.1 /100 | #264 | Tragic 15.6% |
| Immigrants | Liberia | 0.1 /100 | #265 | Tragic 15.7% |
| Immigrants | El Salvador | 0.1 /100 | #266 | Tragic 15.7% |
| Sub-Saharan Africans | 0.1 /100 | #267 | Tragic 15.8% |
| Immigrants | Nicaragua | 0.1 /100 | #268 | Tragic 15.8% |
| Iroquois | 0.1 /100 | #269 | Tragic 15.8% |
| Chickasaw | 0.1 /100 | #270 | Tragic 15.9% |