British West Indian vs Immigrants from Uruguay Female Poverty Among 18-24 Year Olds
COMPARE
British West Indian
Immigrants from Uruguay
Female Poverty Among 18-24 Year Olds
Female Poverty Among 18-24 Year Olds Comparison
British West Indians
Immigrants from Uruguay
21.2%
FEMALE POVERTY AMONG 18-24 YEAR OLDS
1.2/ 100
METRIC RATING
254th/ 347
METRIC RANK
18.8%
FEMALE POVERTY AMONG 18-24 YEAR OLDS
99.4/ 100
METRIC RATING
82nd/ 347
METRIC RANK
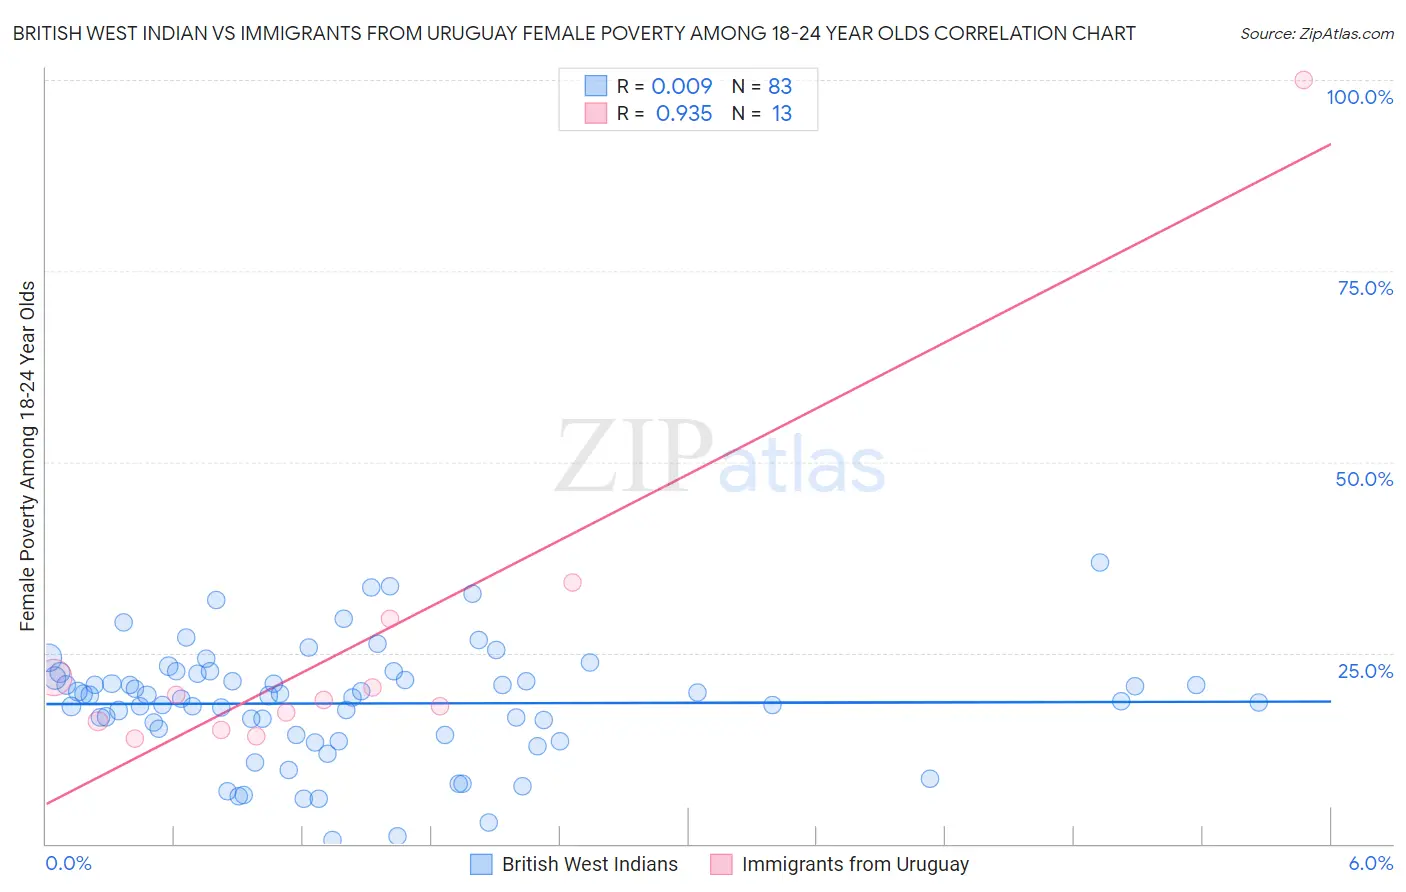
British West Indian vs Immigrants from Uruguay Female Poverty Among 18-24 Year Olds Correlation Chart
The statistical analysis conducted on geographies consisting of 151,313,646 people shows no correlation between the proportion of British West Indians and poverty level among females between the ages 18 and 24 in the United States with a correlation coefficient (R) of 0.009 and weighted average of 21.2%. Similarly, the statistical analysis conducted on geographies consisting of 132,156,159 people shows a near-perfect positive correlation between the proportion of Immigrants from Uruguay and poverty level among females between the ages 18 and 24 in the United States with a correlation coefficient (R) of 0.935 and weighted average of 18.8%, a difference of 12.5%.
Female Poverty Among 18-24 Year Olds Correlation Summary
| Measurement | British West Indian | Immigrants from Uruguay |
| Minimum | 0.52% | 13.8% |
| Maximum | 36.8% | 100.0% |
| Range | 36.3% | 86.2% |
| Mean | 18.4% | 26.0% |
| Median | 19.4% | 18.9% |
| Interquartile 25% (IQ1) | 14.3% | 15.4% |
| Interquartile 75% (IQ3) | 22.3% | 25.6% |
| Interquartile Range (IQR) | 8.1% | 10.2% |
| Standard Deviation (Sample) | 7.4% | 23.0% |
| Standard Deviation (Population) | 7.3% | 22.1% |
Similar Demographics by Female Poverty Among 18-24 Year Olds
Demographics Similar to British West Indians by Female Poverty Among 18-24 Year Olds
In terms of female poverty among 18-24 year olds, the demographic groups most similar to British West Indians are Immigrants from Grenada (21.2%, a difference of 0.030%), Tsimshian (21.2%, a difference of 0.18%), Delaware (21.1%, a difference of 0.29%), Taiwanese (21.2%, a difference of 0.29%), and South African (21.1%, a difference of 0.33%).
| Demographics | Rating | Rank | Female Poverty Among 18-24 Year Olds |
| Immigrants | Africa | 3.0 /100 | #247 | Tragic 21.0% |
| Immigrants | Kenya | 2.5 /100 | #248 | Tragic 21.0% |
| Carpatho Rusyns | 2.5 /100 | #249 | Tragic 21.0% |
| Immigrants | West Indies | 2.2 /100 | #250 | Tragic 21.0% |
| West Indians | 1.9 /100 | #251 | Tragic 21.1% |
| South Africans | 1.6 /100 | #252 | Tragic 21.1% |
| Delaware | 1.6 /100 | #253 | Tragic 21.1% |
| British West Indians | 1.2 /100 | #254 | Tragic 21.2% |
| Immigrants | Grenada | 1.2 /100 | #255 | Tragic 21.2% |
| Tsimshian | 1.0 /100 | #256 | Tragic 21.2% |
| Taiwanese | 1.0 /100 | #257 | Tragic 21.2% |
| Vietnamese | 0.6 /100 | #258 | Tragic 21.4% |
| Immigrants | France | 0.6 /100 | #259 | Tragic 21.4% |
| Immigrants | Norway | 0.6 /100 | #260 | Tragic 21.4% |
| Immigrants | Bahamas | 0.5 /100 | #261 | Tragic 21.4% |
Demographics Similar to Immigrants from Uruguay by Female Poverty Among 18-24 Year Olds
In terms of female poverty among 18-24 year olds, the demographic groups most similar to Immigrants from Uruguay are Immigrants from Indonesia (18.9%, a difference of 0.090%), Palestinian (18.8%, a difference of 0.11%), Japanese (18.8%, a difference of 0.11%), Immigrants from Europe (18.8%, a difference of 0.19%), and Uruguayan (18.8%, a difference of 0.19%).
| Demographics | Rating | Rank | Female Poverty Among 18-24 Year Olds |
| Poles | 99.6 /100 | #75 | Exceptional 18.8% |
| Immigrants | Cambodia | 99.5 /100 | #76 | Exceptional 18.8% |
| Costa Ricans | 99.5 /100 | #77 | Exceptional 18.8% |
| Immigrants | Europe | 99.5 /100 | #78 | Exceptional 18.8% |
| Uruguayans | 99.5 /100 | #79 | Exceptional 18.8% |
| Palestinians | 99.5 /100 | #80 | Exceptional 18.8% |
| Japanese | 99.5 /100 | #81 | Exceptional 18.8% |
| Immigrants | Uruguay | 99.4 /100 | #82 | Exceptional 18.8% |
| Immigrants | Indonesia | 99.4 /100 | #83 | Exceptional 18.9% |
| Burmese | 99.2 /100 | #84 | Exceptional 18.9% |
| Immigrants | Armenia | 99.2 /100 | #85 | Exceptional 18.9% |
| Immigrants | Iraq | 99.2 /100 | #86 | Exceptional 18.9% |
| Immigrants | Jamaica | 99.2 /100 | #87 | Exceptional 18.9% |
| Croatians | 99.1 /100 | #88 | Exceptional 19.0% |
| Immigrants | Cabo Verde | 99.0 /100 | #89 | Exceptional 19.0% |