British vs Hungarian Receiving Food Stamps
COMPARE
British
Hungarian
Receiving Food Stamps
Receiving Food Stamps Comparison
British
Hungarians
9.7%
RECEIVING FOOD STAMPS
99.2/ 100
METRIC RATING
59th/ 347
METRIC RANK
11.0%
RECEIVING FOOD STAMPS
85.1/ 100
METRIC RATING
145th/ 347
METRIC RANK
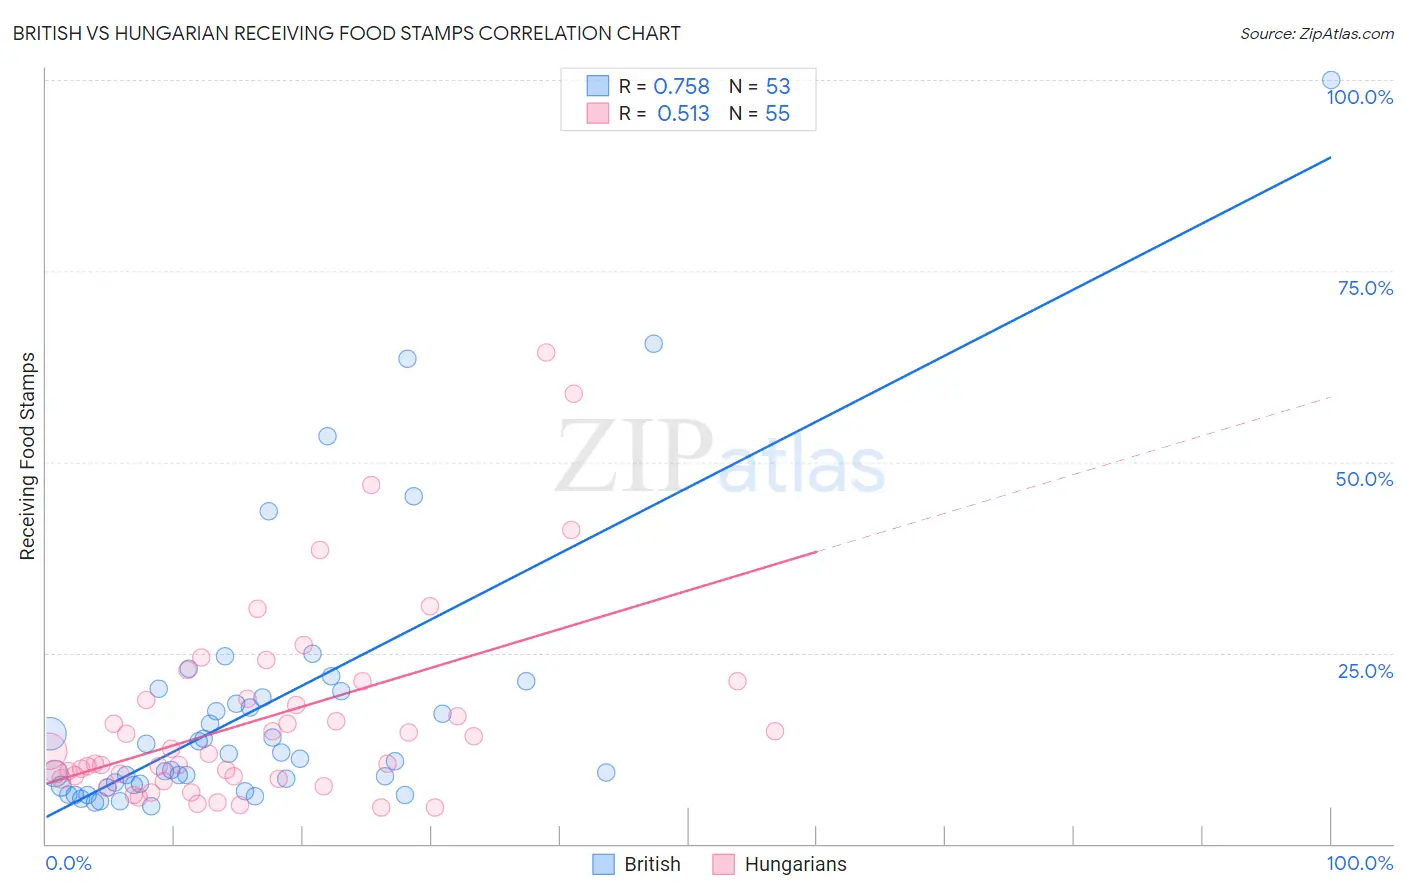
British vs Hungarian Receiving Food Stamps Correlation Chart
The statistical analysis conducted on geographies consisting of 528,917,419 people shows a strong positive correlation between the proportion of British and percentage of population receiving government assistance and/or food stamps in the United States with a correlation coefficient (R) of 0.758 and weighted average of 9.7%. Similarly, the statistical analysis conducted on geographies consisting of 483,983,942 people shows a substantial positive correlation between the proportion of Hungarians and percentage of population receiving government assistance and/or food stamps in the United States with a correlation coefficient (R) of 0.513 and weighted average of 11.0%, a difference of 13.2%.
Receiving Food Stamps Correlation Summary
| Measurement | British | Hungarian |
| Minimum | 4.9% | 4.7% |
| Maximum | 100.0% | 64.4% |
| Range | 95.1% | 59.7% |
| Mean | 17.6% | 16.3% |
| Median | 11.1% | 11.7% |
| Interquartile 25% (IQ1) | 7.6% | 8.5% |
| Interquartile 75% (IQ3) | 19.6% | 19.0% |
| Interquartile Range (IQR) | 12.0% | 10.5% |
| Standard Deviation (Sample) | 18.1% | 12.9% |
| Standard Deviation (Population) | 17.9% | 12.7% |
Similar Demographics by Receiving Food Stamps
Demographics Similar to British by Receiving Food Stamps
In terms of receiving food stamps, the demographic groups most similar to British are Scandinavian (9.7%, a difference of 0.030%), Greek (9.7%, a difference of 0.090%), German (9.7%, a difference of 0.10%), Immigrants from Canada (9.7%, a difference of 0.20%), and English (9.8%, a difference of 0.24%).
| Demographics | Rating | Rank | Receiving Food Stamps |
| Immigrants | South Africa | 99.3 /100 | #52 | Exceptional 9.7% |
| Tongans | 99.3 /100 | #53 | Exceptional 9.7% |
| Swiss | 99.3 /100 | #54 | Exceptional 9.7% |
| Immigrants | Switzerland | 99.3 /100 | #55 | Exceptional 9.7% |
| Immigrants | Canada | 99.3 /100 | #56 | Exceptional 9.7% |
| Greeks | 99.3 /100 | #57 | Exceptional 9.7% |
| Scandinavians | 99.2 /100 | #58 | Exceptional 9.7% |
| British | 99.2 /100 | #59 | Exceptional 9.7% |
| Germans | 99.2 /100 | #60 | Exceptional 9.7% |
| English | 99.2 /100 | #61 | Exceptional 9.8% |
| Immigrants | Bulgaria | 99.2 /100 | #62 | Exceptional 9.8% |
| Chinese | 99.2 /100 | #63 | Exceptional 9.8% |
| Immigrants | North America | 99.2 /100 | #64 | Exceptional 9.8% |
| Immigrants | Turkey | 99.1 /100 | #65 | Exceptional 9.8% |
| Slovenes | 99.1 /100 | #66 | Exceptional 9.8% |
Demographics Similar to Hungarians by Receiving Food Stamps
In terms of receiving food stamps, the demographic groups most similar to Hungarians are Syrian (11.0%, a difference of 0.12%), Taiwanese (11.0%, a difference of 0.24%), Immigrants from Northern Africa (11.0%, a difference of 0.27%), White/Caucasian (11.1%, a difference of 0.34%), and Chilean (11.0%, a difference of 0.35%).
| Demographics | Rating | Rank | Receiving Food Stamps |
| Immigrants | Moldova | 88.5 /100 | #138 | Excellent 10.9% |
| Hmong | 88.4 /100 | #139 | Excellent 10.9% |
| Celtics | 87.8 /100 | #140 | Excellent 10.9% |
| Immigrants | Vietnam | 86.7 /100 | #141 | Excellent 11.0% |
| Chileans | 86.2 /100 | #142 | Excellent 11.0% |
| Immigrants | Northern Africa | 86.0 /100 | #143 | Excellent 11.0% |
| Syrians | 85.5 /100 | #144 | Excellent 11.0% |
| Hungarians | 85.1 /100 | #145 | Excellent 11.0% |
| Taiwanese | 84.2 /100 | #146 | Excellent 11.0% |
| Whites/Caucasians | 83.9 /100 | #147 | Excellent 11.1% |
| Immigrants | South Eastern Asia | 83.3 /100 | #148 | Excellent 11.1% |
| Brazilians | 83.2 /100 | #149 | Excellent 11.1% |
| Soviet Union | 83.1 /100 | #150 | Excellent 11.1% |
| Immigrants | Spain | 81.7 /100 | #151 | Excellent 11.1% |
| Immigrants | Kazakhstan | 81.7 /100 | #152 | Excellent 11.1% |