British vs Burmese Poverty
COMPARE
British
Burmese
Poverty
Poverty Comparison
British
Burmese
11.4%
POVERTY
95.0/ 100
METRIC RATING
92nd/ 347
METRIC RANK
10.7%
POVERTY
99.6/ 100
METRIC RATING
26th/ 347
METRIC RANK
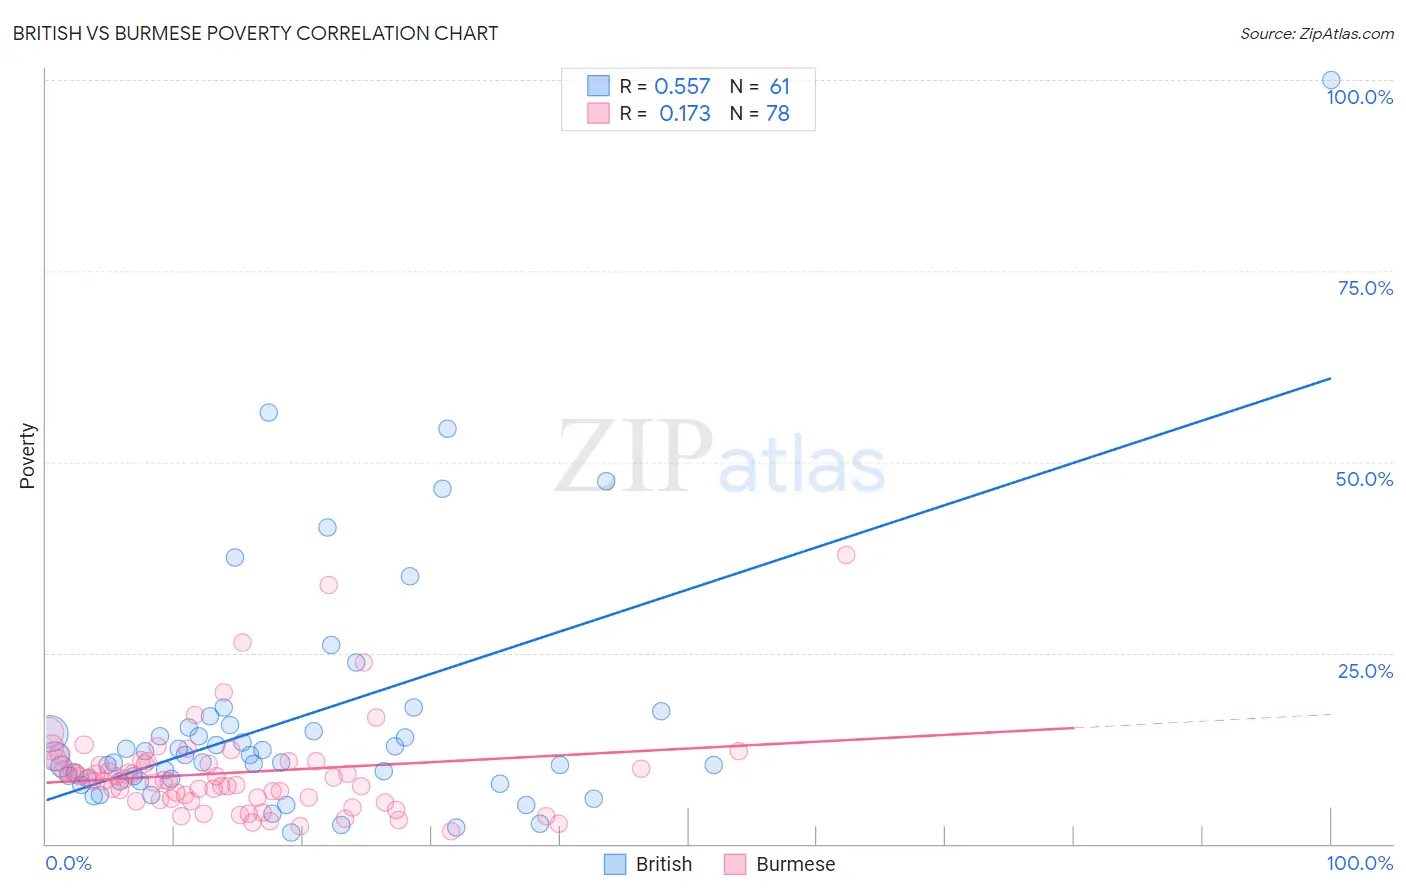
British vs Burmese Poverty Correlation Chart
The statistical analysis conducted on geographies consisting of 530,938,105 people shows a substantial positive correlation between the proportion of British and poverty level in the United States with a correlation coefficient (R) of 0.557 and weighted average of 11.4%. Similarly, the statistical analysis conducted on geographies consisting of 464,896,901 people shows a poor positive correlation between the proportion of Burmese and poverty level in the United States with a correlation coefficient (R) of 0.173 and weighted average of 10.7%, a difference of 7.2%.
Poverty Correlation Summary
| Measurement | British | Burmese |
| Minimum | 1.5% | 1.6% |
| Maximum | 100.0% | 37.7% |
| Range | 98.5% | 36.2% |
| Mean | 16.2% | 9.3% |
| Median | 11.4% | 8.4% |
| Interquartile 25% (IQ1) | 8.4% | 5.8% |
| Interquartile 75% (IQ3) | 15.4% | 10.8% |
| Interquartile Range (IQR) | 7.0% | 4.9% |
| Standard Deviation (Sample) | 16.5% | 6.2% |
| Standard Deviation (Population) | 16.3% | 6.1% |
Similar Demographics by Poverty
Demographics Similar to British by Poverty
In terms of poverty, the demographic groups most similar to British are Romanian (11.4%, a difference of 0.030%), Paraguayan (11.4%, a difference of 0.060%), Australian (11.4%, a difference of 0.060%), Finnish (11.4%, a difference of 0.14%), and Immigrants from South Africa (11.5%, a difference of 0.18%).
| Demographics | Rating | Rank | Poverty |
| Immigrants | England | 96.2 /100 | #85 | Exceptional 11.4% |
| Jordanians | 96.0 /100 | #86 | Exceptional 11.4% |
| Northern Europeans | 96.0 /100 | #87 | Exceptional 11.4% |
| Belgians | 95.8 /100 | #88 | Exceptional 11.4% |
| Czechoslovakians | 95.7 /100 | #89 | Exceptional 11.4% |
| Immigrants | Denmark | 95.5 /100 | #90 | Exceptional 11.4% |
| Finns | 95.2 /100 | #91 | Exceptional 11.4% |
| British | 95.0 /100 | #92 | Exceptional 11.4% |
| Romanians | 94.9 /100 | #93 | Exceptional 11.4% |
| Paraguayans | 94.9 /100 | #94 | Exceptional 11.4% |
| Australians | 94.9 /100 | #95 | Exceptional 11.4% |
| Immigrants | South Africa | 94.7 /100 | #96 | Exceptional 11.5% |
| Immigrants | Egypt | 94.6 /100 | #97 | Exceptional 11.5% |
| Immigrants | Latvia | 94.5 /100 | #98 | Exceptional 11.5% |
| Immigrants | Indonesia | 94.2 /100 | #99 | Exceptional 11.5% |
Demographics Similar to Burmese by Poverty
In terms of poverty, the demographic groups most similar to Burmese are Croatian (10.6%, a difference of 0.31%), Immigrants from Northern Europe (10.7%, a difference of 0.36%), Immigrants from Korea (10.7%, a difference of 0.42%), Italian (10.6%, a difference of 0.50%), and Greek (10.7%, a difference of 0.52%).
| Demographics | Rating | Rank | Poverty |
| Immigrants | Scotland | 99.7 /100 | #19 | Exceptional 10.6% |
| Immigrants | North Macedonia | 99.7 /100 | #20 | Exceptional 10.6% |
| Luxembourgers | 99.7 /100 | #21 | Exceptional 10.6% |
| Eastern Europeans | 99.7 /100 | #22 | Exceptional 10.6% |
| Swedes | 99.7 /100 | #23 | Exceptional 10.6% |
| Italians | 99.7 /100 | #24 | Exceptional 10.6% |
| Croatians | 99.6 /100 | #25 | Exceptional 10.6% |
| Burmese | 99.6 /100 | #26 | Exceptional 10.7% |
| Immigrants | Northern Europe | 99.6 /100 | #27 | Exceptional 10.7% |
| Immigrants | Korea | 99.5 /100 | #28 | Exceptional 10.7% |
| Greeks | 99.5 /100 | #29 | Exceptional 10.7% |
| Danes | 99.5 /100 | #30 | Exceptional 10.7% |
| Poles | 99.5 /100 | #31 | Exceptional 10.7% |
| Iranians | 99.5 /100 | #32 | Exceptional 10.7% |
| Macedonians | 99.4 /100 | #33 | Exceptional 10.8% |