Black/African American vs Immigrants from Argentina Female Poverty Among 25-34 Year Olds
COMPARE
Black/African American
Immigrants from Argentina
Female Poverty Among 25-34 Year Olds
Female Poverty Among 25-34 Year Olds Comparison
Blacks/African Americans
Immigrants from Argentina
18.9%
FEMALE POVERTY AMONG 25-34 YEAR OLDS
0.0/ 100
METRIC RATING
326th/ 347
METRIC RANK
12.6%
FEMALE POVERTY AMONG 25-34 YEAR OLDS
96.4/ 100
METRIC RATING
99th/ 347
METRIC RANK
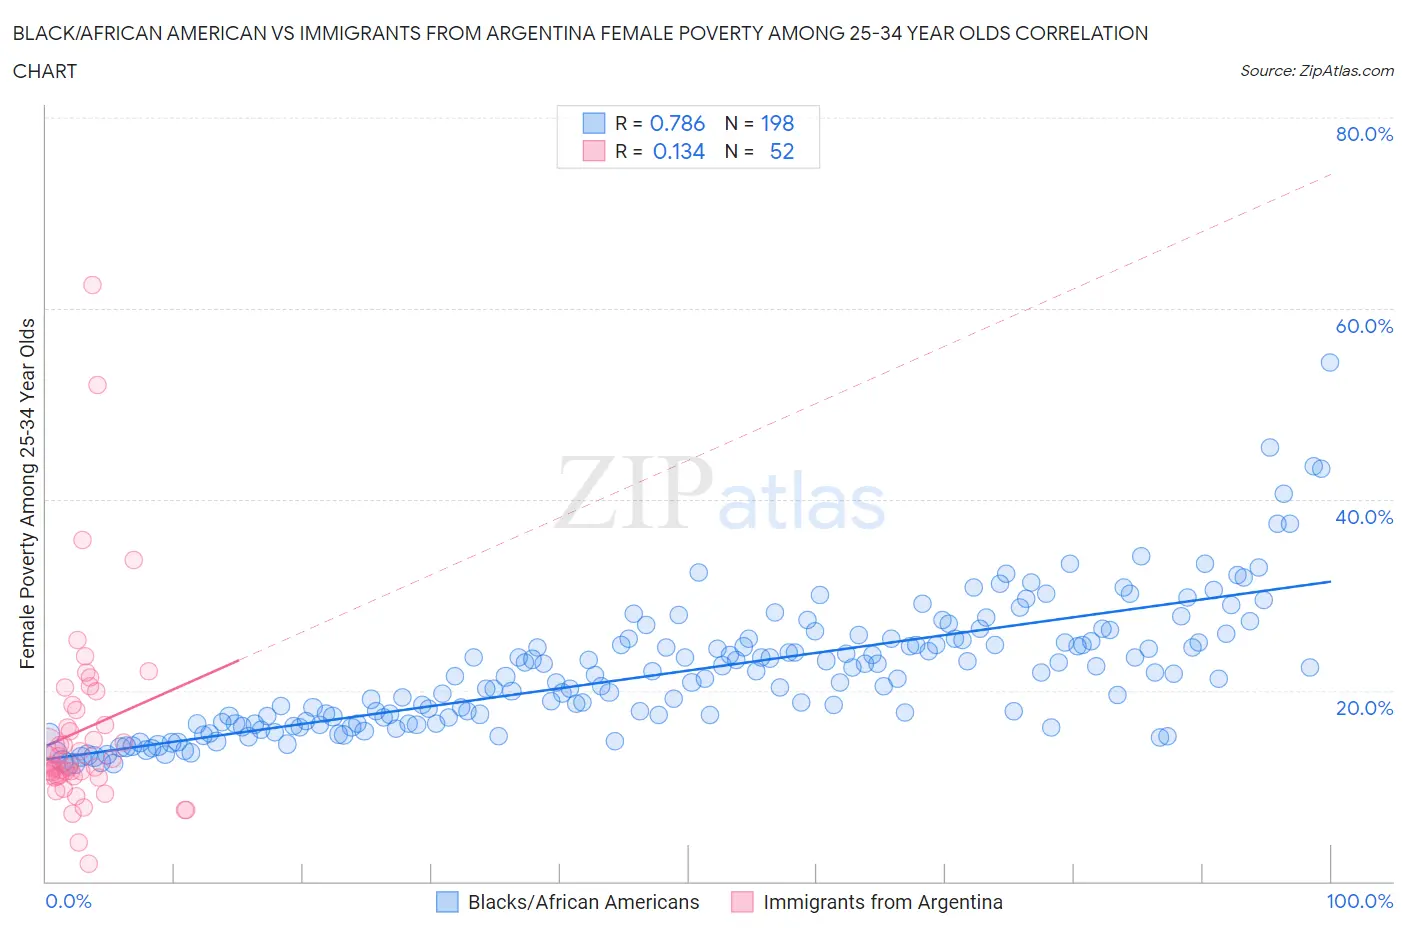
Black/African American vs Immigrants from Argentina Female Poverty Among 25-34 Year Olds Correlation Chart
The statistical analysis conducted on geographies consisting of 547,087,054 people shows a strong positive correlation between the proportion of Blacks/African Americans and poverty level among females between the ages 25 and 34 in the United States with a correlation coefficient (R) of 0.786 and weighted average of 18.9%. Similarly, the statistical analysis conducted on geographies consisting of 261,759,326 people shows a poor positive correlation between the proportion of Immigrants from Argentina and poverty level among females between the ages 25 and 34 in the United States with a correlation coefficient (R) of 0.134 and weighted average of 12.6%, a difference of 50.0%.
Female Poverty Among 25-34 Year Olds Correlation Summary
| Measurement | Black/African American | Immigrants from Argentina |
| Minimum | 12.3% | 1.8% |
| Maximum | 54.3% | 62.5% |
| Range | 42.0% | 60.7% |
| Mean | 22.0% | 15.8% |
| Median | 21.4% | 12.5% |
| Interquartile 25% (IQ1) | 16.5% | 11.0% |
| Interquartile 75% (IQ3) | 25.2% | 18.2% |
| Interquartile Range (IQR) | 8.7% | 7.2% |
| Standard Deviation (Sample) | 6.8% | 10.5% |
| Standard Deviation (Population) | 6.8% | 10.4% |
Similar Demographics by Female Poverty Among 25-34 Year Olds
Demographics Similar to Blacks/African Americans by Female Poverty Among 25-34 Year Olds
In terms of female poverty among 25-34 year olds, the demographic groups most similar to Blacks/African Americans are Cheyenne (19.1%, a difference of 0.96%), Alaskan Athabascan (19.1%, a difference of 1.0%), Creek (19.2%, a difference of 1.3%), Inupiat (18.5%, a difference of 2.0%), and Dutch West Indian (18.4%, a difference of 2.6%).
| Demographics | Rating | Rank | Female Poverty Among 25-34 Year Olds |
| Menominee | 0.0 /100 | #319 | Tragic 18.0% |
| Chippewa | 0.0 /100 | #320 | Tragic 18.0% |
| Choctaw | 0.0 /100 | #321 | Tragic 18.1% |
| Central American Indians | 0.0 /100 | #322 | Tragic 18.2% |
| Seminole | 0.0 /100 | #323 | Tragic 18.3% |
| Dutch West Indians | 0.0 /100 | #324 | Tragic 18.4% |
| Inupiat | 0.0 /100 | #325 | Tragic 18.5% |
| Blacks/African Americans | 0.0 /100 | #326 | Tragic 18.9% |
| Cheyenne | 0.0 /100 | #327 | Tragic 19.1% |
| Alaskan Athabascans | 0.0 /100 | #328 | Tragic 19.1% |
| Creek | 0.0 /100 | #329 | Tragic 19.2% |
| Paiute | 0.0 /100 | #330 | Tragic 19.6% |
| Kiowa | 0.0 /100 | #331 | Tragic 19.7% |
| Immigrants | Yemen | 0.0 /100 | #332 | Tragic 19.8% |
| Cajuns | 0.0 /100 | #333 | Tragic 19.9% |
Demographics Similar to Immigrants from Argentina by Female Poverty Among 25-34 Year Olds
In terms of female poverty among 25-34 year olds, the demographic groups most similar to Immigrants from Argentina are Immigrants from Northern Africa (12.6%, a difference of 0.11%), Immigrants from Ethiopia (12.6%, a difference of 0.11%), Immigrants from Zimbabwe (12.6%, a difference of 0.23%), Ukrainian (12.6%, a difference of 0.24%), and Immigrants from France (12.6%, a difference of 0.28%).
| Demographics | Rating | Rank | Female Poverty Among 25-34 Year Olds |
| Immigrants | Armenia | 96.9 /100 | #92 | Exceptional 12.6% |
| Palestinians | 96.9 /100 | #93 | Exceptional 12.6% |
| Immigrants | France | 96.8 /100 | #94 | Exceptional 12.6% |
| Ukrainians | 96.7 /100 | #95 | Exceptional 12.6% |
| Immigrants | Zimbabwe | 96.7 /100 | #96 | Exceptional 12.6% |
| Immigrants | Northern Africa | 96.6 /100 | #97 | Exceptional 12.6% |
| Immigrants | Ethiopia | 96.5 /100 | #98 | Exceptional 12.6% |
| Immigrants | Argentina | 96.4 /100 | #99 | Exceptional 12.6% |
| Immigrants | Denmark | 95.7 /100 | #100 | Exceptional 12.7% |
| Immigrants | Switzerland | 95.7 /100 | #101 | Exceptional 12.7% |
| Peruvians | 95.6 /100 | #102 | Exceptional 12.7% |
| Immigrants | Spain | 95.5 /100 | #103 | Exceptional 12.7% |
| Swedes | 95.4 /100 | #104 | Exceptional 12.7% |
| Immigrants | South Africa | 95.3 /100 | #105 | Exceptional 12.7% |
| Tsimshian | 95.1 /100 | #106 | Exceptional 12.7% |