Black/African American vs Basque Female Poverty Among 25-34 Year Olds
COMPARE
Black/African American
Basque
Female Poverty Among 25-34 Year Olds
Female Poverty Among 25-34 Year Olds Comparison
Blacks/African Americans
Basques
18.9%
FEMALE POVERTY AMONG 25-34 YEAR OLDS
0.0/ 100
METRIC RATING
326th/ 347
METRIC RANK
13.4%
FEMALE POVERTY AMONG 25-34 YEAR OLDS
59.3/ 100
METRIC RATING
165th/ 347
METRIC RANK
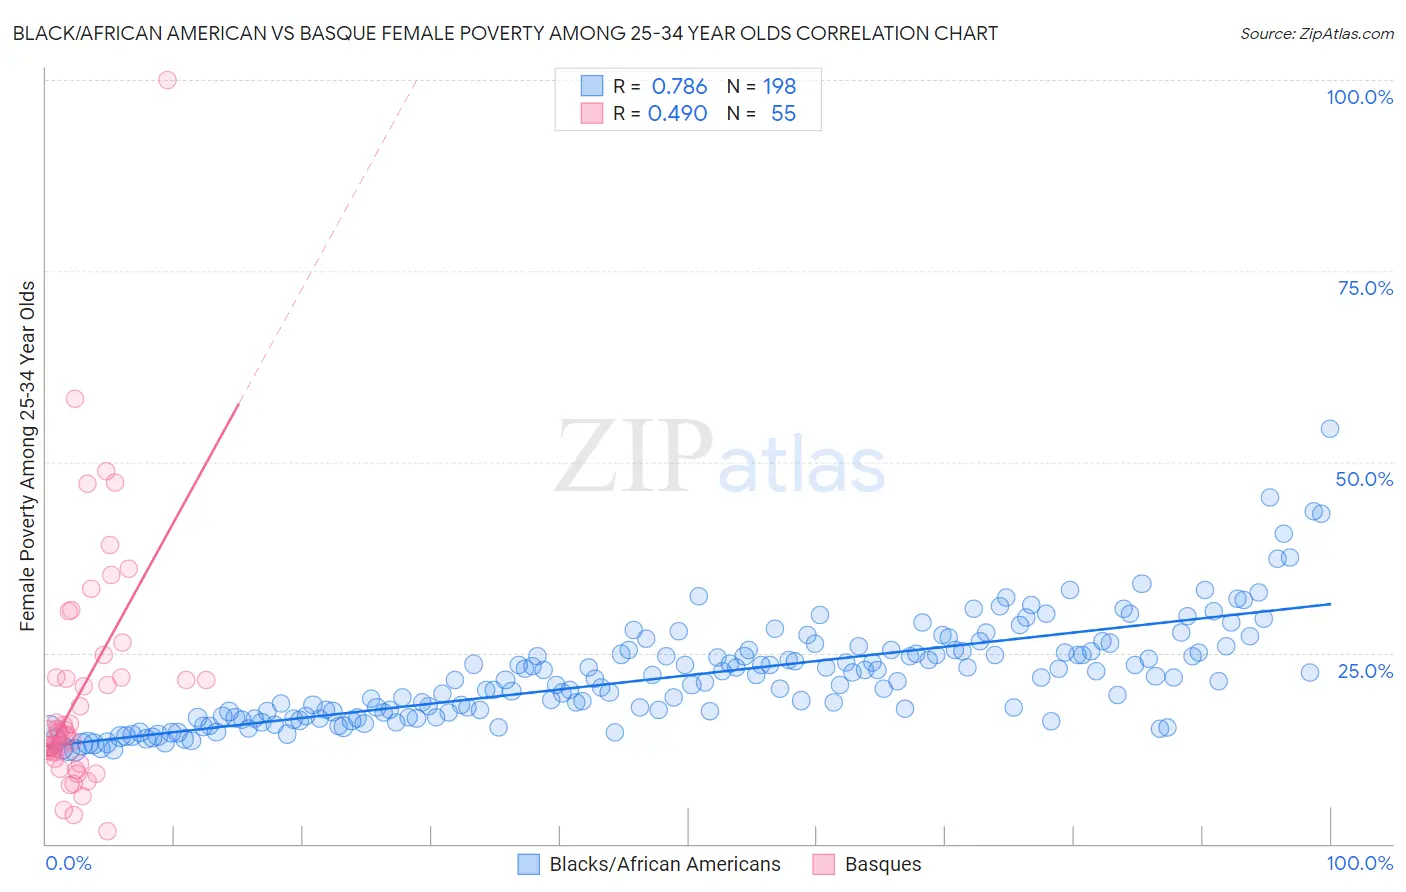
Black/African American vs Basque Female Poverty Among 25-34 Year Olds Correlation Chart
The statistical analysis conducted on geographies consisting of 547,087,054 people shows a strong positive correlation between the proportion of Blacks/African Americans and poverty level among females between the ages 25 and 34 in the United States with a correlation coefficient (R) of 0.786 and weighted average of 18.9%. Similarly, the statistical analysis conducted on geographies consisting of 164,712,291 people shows a moderate positive correlation between the proportion of Basques and poverty level among females between the ages 25 and 34 in the United States with a correlation coefficient (R) of 0.490 and weighted average of 13.4%, a difference of 40.9%.
Female Poverty Among 25-34 Year Olds Correlation Summary
| Measurement | Black/African American | Basque |
| Minimum | 12.3% | 1.7% |
| Maximum | 54.3% | 100.0% |
| Range | 42.0% | 98.3% |
| Mean | 22.0% | 20.2% |
| Median | 21.4% | 14.4% |
| Interquartile 25% (IQ1) | 16.5% | 12.0% |
| Interquartile 75% (IQ3) | 25.2% | 21.7% |
| Interquartile Range (IQR) | 8.7% | 9.8% |
| Standard Deviation (Sample) | 6.8% | 16.4% |
| Standard Deviation (Population) | 6.8% | 16.2% |
Similar Demographics by Female Poverty Among 25-34 Year Olds
Demographics Similar to Blacks/African Americans by Female Poverty Among 25-34 Year Olds
In terms of female poverty among 25-34 year olds, the demographic groups most similar to Blacks/African Americans are Cheyenne (19.1%, a difference of 0.96%), Alaskan Athabascan (19.1%, a difference of 1.0%), Creek (19.2%, a difference of 1.3%), Inupiat (18.5%, a difference of 2.0%), and Dutch West Indian (18.4%, a difference of 2.6%).
| Demographics | Rating | Rank | Female Poverty Among 25-34 Year Olds |
| Menominee | 0.0 /100 | #319 | Tragic 18.0% |
| Chippewa | 0.0 /100 | #320 | Tragic 18.0% |
| Choctaw | 0.0 /100 | #321 | Tragic 18.1% |
| Central American Indians | 0.0 /100 | #322 | Tragic 18.2% |
| Seminole | 0.0 /100 | #323 | Tragic 18.3% |
| Dutch West Indians | 0.0 /100 | #324 | Tragic 18.4% |
| Inupiat | 0.0 /100 | #325 | Tragic 18.5% |
| Blacks/African Americans | 0.0 /100 | #326 | Tragic 18.9% |
| Cheyenne | 0.0 /100 | #327 | Tragic 19.1% |
| Alaskan Athabascans | 0.0 /100 | #328 | Tragic 19.1% |
| Creek | 0.0 /100 | #329 | Tragic 19.2% |
| Paiute | 0.0 /100 | #330 | Tragic 19.6% |
| Kiowa | 0.0 /100 | #331 | Tragic 19.7% |
| Immigrants | Yemen | 0.0 /100 | #332 | Tragic 19.8% |
| Cajuns | 0.0 /100 | #333 | Tragic 19.9% |
Demographics Similar to Basques by Female Poverty Among 25-34 Year Olds
In terms of female poverty among 25-34 year olds, the demographic groups most similar to Basques are Belgian (13.4%, a difference of 0.030%), Immigrants from Bosnia and Herzegovina (13.4%, a difference of 0.060%), Immigrants from Afghanistan (13.4%, a difference of 0.14%), Swiss (13.4%, a difference of 0.21%), and Samoan (13.5%, a difference of 0.21%).
| Demographics | Rating | Rank | Female Poverty Among 25-34 Year Olds |
| Immigrants | Colombia | 69.2 /100 | #158 | Good 13.3% |
| Uruguayans | 66.9 /100 | #159 | Good 13.3% |
| Immigrants | South America | 66.3 /100 | #160 | Good 13.3% |
| Icelanders | 65.7 /100 | #161 | Good 13.3% |
| Ugandans | 64.1 /100 | #162 | Good 13.4% |
| British | 63.5 /100 | #163 | Good 13.4% |
| Swiss | 61.7 /100 | #164 | Good 13.4% |
| Basques | 59.3 /100 | #165 | Average 13.4% |
| Belgians | 58.9 /100 | #166 | Average 13.4% |
| Immigrants | Bosnia and Herzegovina | 58.6 /100 | #167 | Average 13.4% |
| Immigrants | Afghanistan | 57.7 /100 | #168 | Average 13.4% |
| Samoans | 56.8 /100 | #169 | Average 13.5% |
| Immigrants | Uganda | 53.0 /100 | #170 | Average 13.5% |
| South American Indians | 51.9 /100 | #171 | Average 13.5% |
| Immigrants | Costa Rica | 51.9 /100 | #172 | Average 13.5% |