Bermudan vs Immigrants from Venezuela Receiving Food Stamps
COMPARE
Bermudan
Immigrants from Venezuela
Receiving Food Stamps
Receiving Food Stamps Comparison
Bermudans
Immigrants from Venezuela
13.0%
RECEIVING FOOD STAMPS
4.8/ 100
METRIC RATING
221st/ 347
METRIC RANK
12.3%
RECEIVING FOOD STAMPS
20.1/ 100
METRIC RATING
202nd/ 347
METRIC RANK
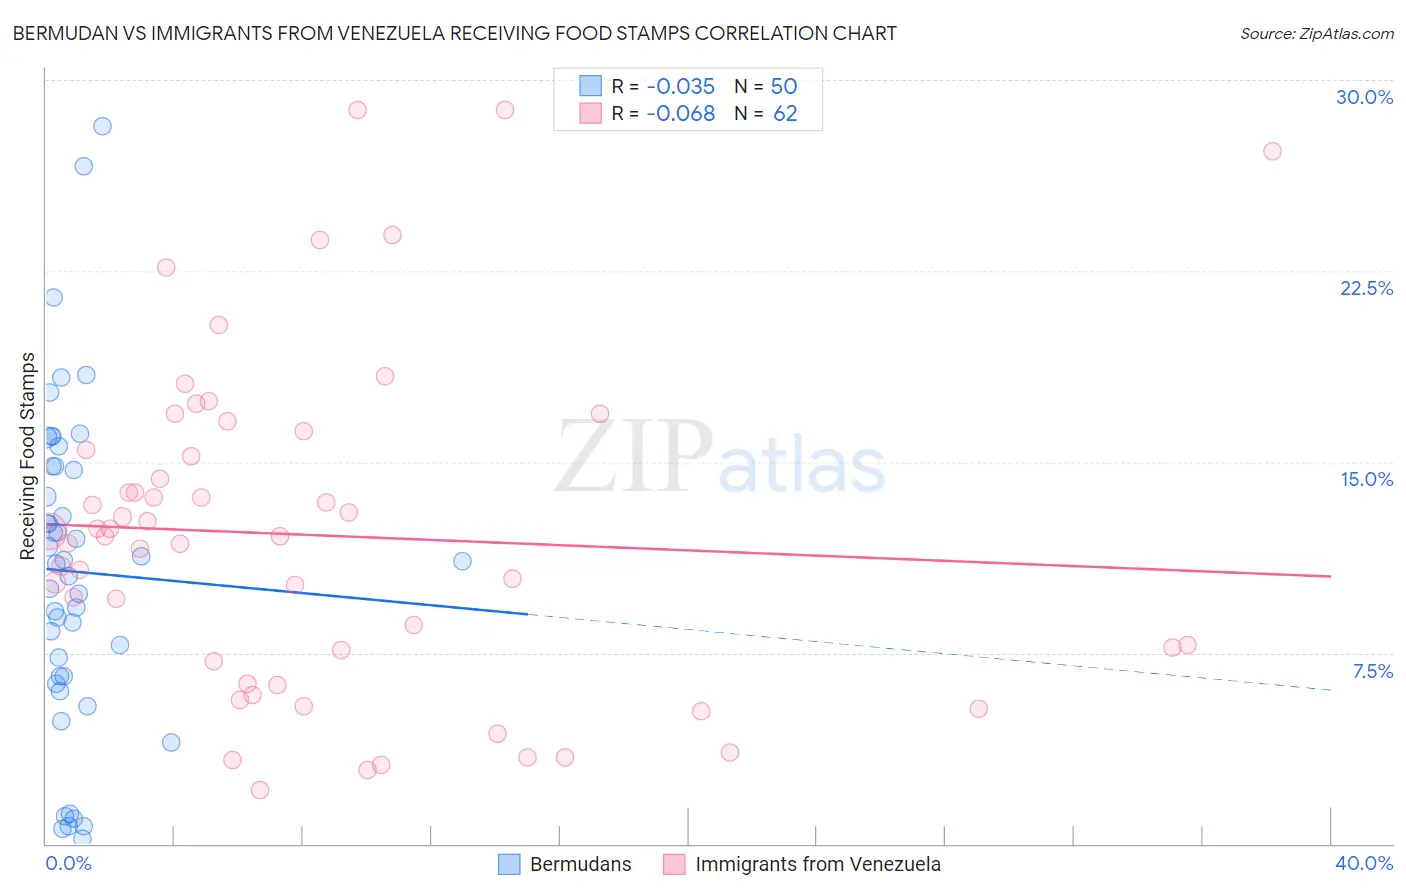
Bermudan vs Immigrants from Venezuela Receiving Food Stamps Correlation Chart
The statistical analysis conducted on geographies consisting of 55,651,694 people shows no correlation between the proportion of Bermudans and percentage of population receiving government assistance and/or food stamps in the United States with a correlation coefficient (R) of -0.035 and weighted average of 13.0%. Similarly, the statistical analysis conducted on geographies consisting of 287,368,478 people shows a slight negative correlation between the proportion of Immigrants from Venezuela and percentage of population receiving government assistance and/or food stamps in the United States with a correlation coefficient (R) of -0.068 and weighted average of 12.3%, a difference of 5.4%.
Receiving Food Stamps Correlation Summary
| Measurement | Bermudan | Immigrants from Venezuela |
| Minimum | 0.20% | 2.1% |
| Maximum | 28.2% | 28.8% |
| Range | 28.0% | 26.7% |
| Mean | 10.7% | 12.1% |
| Median | 11.1% | 12.1% |
| Interquartile 25% (IQ1) | 6.6% | 7.2% |
| Interquartile 75% (IQ3) | 14.8% | 15.5% |
| Interquartile Range (IQR) | 8.2% | 8.3% |
| Standard Deviation (Sample) | 6.3% | 6.4% |
| Standard Deviation (Population) | 6.3% | 6.4% |
Demographics Similar to Bermudans and Immigrants from Venezuela by Receiving Food Stamps
In terms of receiving food stamps, the demographic groups most similar to Bermudans are Immigrants from Colombia (12.9%, a difference of 0.32%), Immigrants from Middle Africa (12.9%, a difference of 0.36%), Hawaiian (12.9%, a difference of 0.37%), Immigrants from Burma/Myanmar (12.9%, a difference of 0.74%), and Immigrants from South America (12.8%, a difference of 1.0%). Similarly, the demographic groups most similar to Immigrants from Venezuela are Ugandan (12.2%, a difference of 0.48%), Shoshone (12.4%, a difference of 0.53%), Nonimmigrants (12.4%, a difference of 0.56%), Aleut (12.4%, a difference of 0.62%), and Immigrants from Thailand (12.4%, a difference of 0.69%).
| Demographics | Rating | Rank | Receiving Food Stamps |
| Ugandans | 22.5 /100 | #201 | Fair 12.2% |
| Immigrants | Venezuela | 20.1 /100 | #202 | Fair 12.3% |
| Shoshone | 17.7 /100 | #203 | Poor 12.4% |
| Immigrants | Nonimmigrants | 17.6 /100 | #204 | Poor 12.4% |
| Aleuts | 17.3 /100 | #205 | Poor 12.4% |
| Immigrants | Thailand | 17.0 /100 | #206 | Poor 12.4% |
| South Americans | 16.0 /100 | #207 | Poor 12.4% |
| Potawatomi | 14.6 /100 | #208 | Poor 12.5% |
| Immigrants | Sierra Leone | 12.9 /100 | #209 | Poor 12.5% |
| Immigrants | Uruguay | 12.8 /100 | #210 | Poor 12.5% |
| Colombians | 10.2 /100 | #211 | Poor 12.6% |
| Malaysians | 8.5 /100 | #212 | Tragic 12.7% |
| Moroccans | 7.6 /100 | #213 | Tragic 12.8% |
| Immigrants | Africa | 7.6 /100 | #214 | Tragic 12.8% |
| Native Hawaiians | 6.7 /100 | #215 | Tragic 12.8% |
| Immigrants | South America | 6.5 /100 | #216 | Tragic 12.8% |
| Immigrants | Burma/Myanmar | 6.0 /100 | #217 | Tragic 12.9% |
| Hawaiians | 5.4 /100 | #218 | Tragic 12.9% |
| Immigrants | Middle Africa | 5.4 /100 | #219 | Tragic 12.9% |
| Immigrants | Colombia | 5.3 /100 | #220 | Tragic 12.9% |
| Bermudans | 4.8 /100 | #221 | Tragic 13.0% |