Barbadian vs Lumbee Female Poverty
COMPARE
Barbadian
Lumbee
Female Poverty
Female Poverty Comparison
Barbadians
Lumbee
15.9%
FEMALE POVERTY
0.0/ 100
METRIC RATING
274th/ 347
METRIC RANK
23.5%
FEMALE POVERTY
0.0/ 100
METRIC RATING
343rd/ 347
METRIC RANK
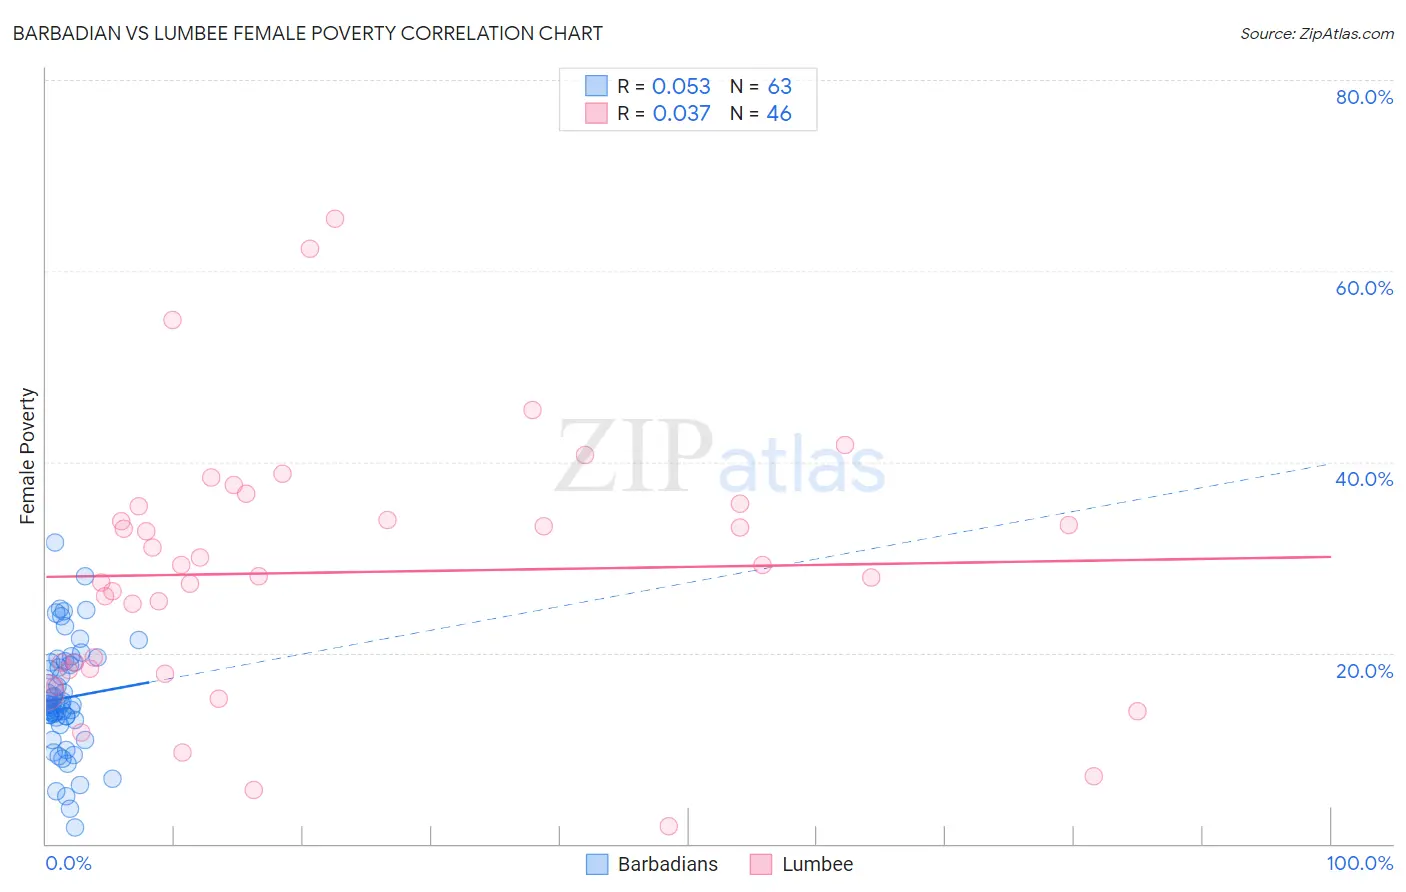
Barbadian vs Lumbee Female Poverty Correlation Chart
The statistical analysis conducted on geographies consisting of 141,263,328 people shows a slight positive correlation between the proportion of Barbadians and poverty level among females in the United States with a correlation coefficient (R) of 0.053 and weighted average of 15.9%. Similarly, the statistical analysis conducted on geographies consisting of 92,256,229 people shows no correlation between the proportion of Lumbee and poverty level among females in the United States with a correlation coefficient (R) of 0.037 and weighted average of 23.5%, a difference of 47.5%.
Female Poverty Correlation Summary
| Measurement | Barbadian | Lumbee |
| Minimum | 1.7% | 1.9% |
| Maximum | 31.5% | 65.5% |
| Range | 29.8% | 63.6% |
| Mean | 15.3% | 28.4% |
| Median | 14.6% | 28.6% |
| Interquartile 25% (IQ1) | 13.0% | 18.3% |
| Interquartile 75% (IQ3) | 18.9% | 35.3% |
| Interquartile Range (IQR) | 5.9% | 17.0% |
| Standard Deviation (Sample) | 5.8% | 13.4% |
| Standard Deviation (Population) | 5.8% | 13.3% |
Similar Demographics by Female Poverty
Demographics Similar to Barbadians by Female Poverty
In terms of female poverty, the demographic groups most similar to Barbadians are Haitian (15.9%, a difference of 0.0%), Belizean (15.9%, a difference of 0.010%), Immigrants from Barbados (16.0%, a difference of 0.070%), Central American (16.0%, a difference of 0.19%), and Immigrants from St. Vincent and the Grenadines (15.9%, a difference of 0.24%).
| Demographics | Rating | Rank | Female Poverty |
| Sub-Saharan Africans | 0.1 /100 | #267 | Tragic 15.8% |
| Immigrants | Nicaragua | 0.1 /100 | #268 | Tragic 15.8% |
| Iroquois | 0.1 /100 | #269 | Tragic 15.8% |
| Chickasaw | 0.1 /100 | #270 | Tragic 15.9% |
| Immigrants | St. Vincent and the Grenadines | 0.0 /100 | #271 | Tragic 15.9% |
| Belizeans | 0.0 /100 | #272 | Tragic 15.9% |
| Haitians | 0.0 /100 | #273 | Tragic 15.9% |
| Barbadians | 0.0 /100 | #274 | Tragic 15.9% |
| Immigrants | Barbados | 0.0 /100 | #275 | Tragic 16.0% |
| Central Americans | 0.0 /100 | #276 | Tragic 16.0% |
| Bangladeshis | 0.0 /100 | #277 | Tragic 16.0% |
| Immigrants | West Indies | 0.0 /100 | #278 | Tragic 16.1% |
| Immigrants | Bahamas | 0.0 /100 | #279 | Tragic 16.1% |
| Vietnamese | 0.0 /100 | #280 | Tragic 16.1% |
| West Indians | 0.0 /100 | #281 | Tragic 16.1% |
Demographics Similar to Lumbee by Female Poverty
In terms of female poverty, the demographic groups most similar to Lumbee are Pima (23.6%, a difference of 0.31%), Navajo (23.9%, a difference of 1.6%), Immigrants from Yemen (22.8%, a difference of 3.0%), Crow (22.1%, a difference of 6.2%), and Puerto Rican (25.2%, a difference of 7.1%).
| Demographics | Rating | Rank | Female Poverty |
| Immigrants | Dominican Republic | 0.0 /100 | #333 | Tragic 19.3% |
| Houma | 0.0 /100 | #334 | Tragic 20.0% |
| Cheyenne | 0.0 /100 | #335 | Tragic 20.2% |
| Pueblo | 0.0 /100 | #336 | Tragic 20.7% |
| Yuman | 0.0 /100 | #337 | Tragic 20.8% |
| Sioux | 0.0 /100 | #338 | Tragic 20.9% |
| Hopi | 0.0 /100 | #339 | Tragic 21.0% |
| Yup'ik | 0.0 /100 | #340 | Tragic 21.5% |
| Crow | 0.0 /100 | #341 | Tragic 22.1% |
| Immigrants | Yemen | 0.0 /100 | #342 | Tragic 22.8% |
| Lumbee | 0.0 /100 | #343 | Tragic 23.5% |
| Pima | 0.0 /100 | #344 | Tragic 23.6% |
| Navajo | 0.0 /100 | #345 | Tragic 23.9% |
| Puerto Ricans | 0.0 /100 | #346 | Tragic 25.2% |
| Tohono O'odham | 0.0 /100 | #347 | Tragic 25.9% |