Assyrian/Chaldean/Syriac vs Immigrants from Turkey Single Mother Poverty
COMPARE
Assyrian/Chaldean/Syriac
Immigrants from Turkey
Single Mother Poverty
Single Mother Poverty Comparison
Assyrians/Chaldeans/Syriacs
Immigrants from Turkey
23.8%
SINGLE MOTHER POVERTY
100.0/ 100
METRIC RATING
1st/ 347
METRIC RANK
27.3%
SINGLE MOTHER POVERTY
99.5/ 100
METRIC RATING
65th/ 347
METRIC RANK
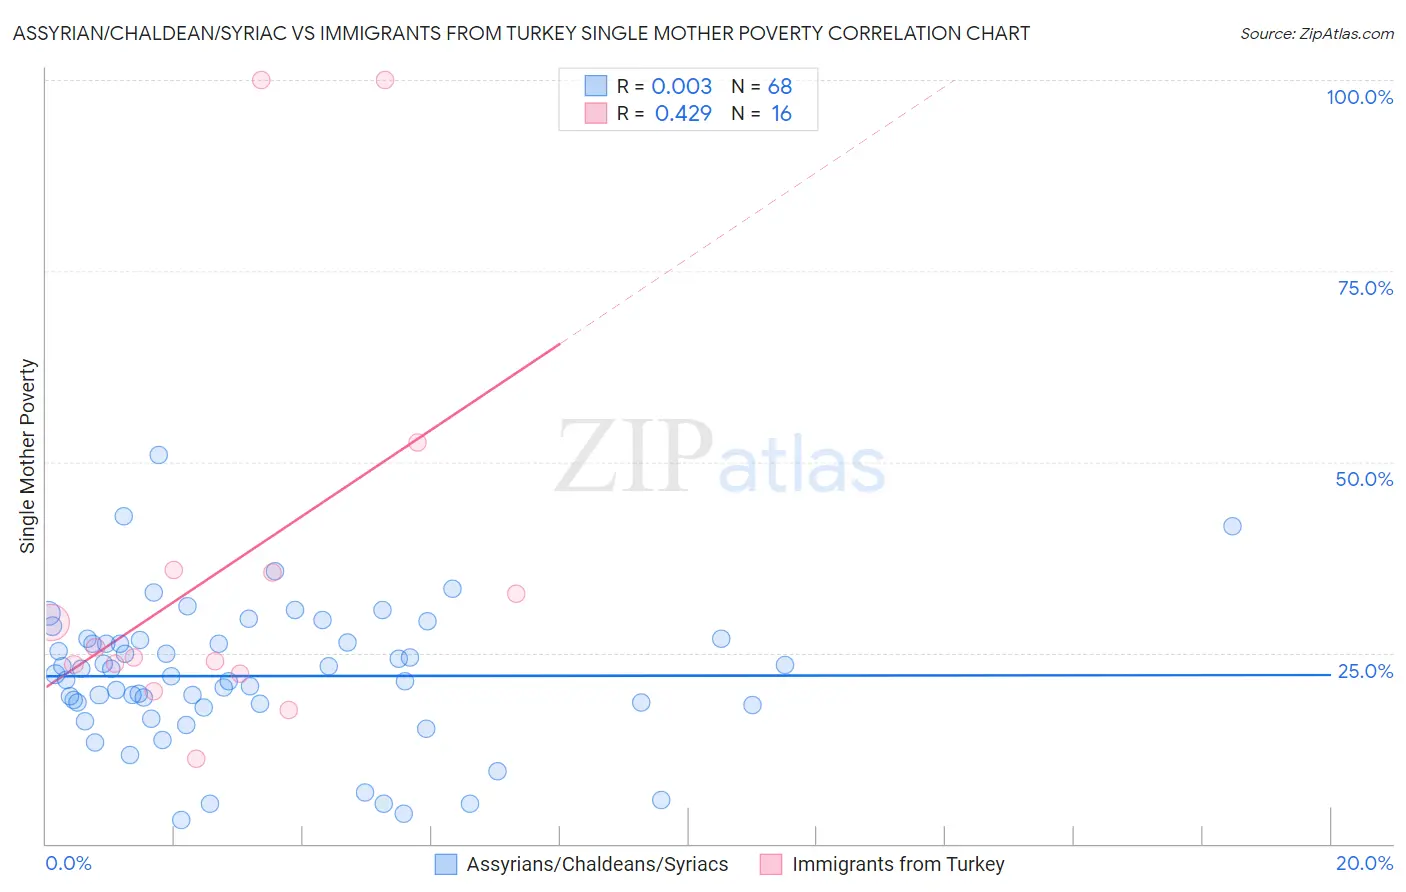
Assyrian/Chaldean/Syriac vs Immigrants from Turkey Single Mother Poverty Correlation Chart
The statistical analysis conducted on geographies consisting of 109,112,991 people shows no correlation between the proportion of Assyrians/Chaldeans/Syriacs and poverty level among single mothers in the United States with a correlation coefficient (R) of 0.003 and weighted average of 23.8%. Similarly, the statistical analysis conducted on geographies consisting of 218,733,554 people shows a moderate positive correlation between the proportion of Immigrants from Turkey and poverty level among single mothers in the United States with a correlation coefficient (R) of 0.429 and weighted average of 27.3%, a difference of 14.8%.
Single Mother Poverty Correlation Summary
| Measurement | Assyrian/Chaldean/Syriac | Immigrants from Turkey |
| Minimum | 3.1% | 11.1% |
| Maximum | 50.9% | 100.0% |
| Range | 47.8% | 88.9% |
| Mean | 22.0% | 36.1% |
| Median | 22.1% | 25.0% |
| Interquartile 25% (IQ1) | 18.2% | 22.8% |
| Interquartile 75% (IQ3) | 26.5% | 35.6% |
| Interquartile Range (IQR) | 8.3% | 12.8% |
| Standard Deviation (Sample) | 9.1% | 26.6% |
| Standard Deviation (Population) | 9.0% | 25.8% |
Similar Demographics by Single Mother Poverty
Demographics Similar to Assyrians/Chaldeans/Syriacs by Single Mother Poverty
In terms of single mother poverty, the demographic groups most similar to Assyrians/Chaldeans/Syriacs are Immigrants from India (23.8%, a difference of 0.020%), Immigrants from Taiwan (23.9%, a difference of 0.21%), Filipino (24.3%, a difference of 2.1%), Immigrants from Hong Kong (24.4%, a difference of 2.4%), and Thai (24.5%, a difference of 2.9%).
| Demographics | Rating | Rank | Single Mother Poverty |
| Assyrians/Chaldeans/Syriacs | 100.0 /100 | #1 | Exceptional 23.8% |
| Immigrants | India | 100.0 /100 | #2 | Exceptional 23.8% |
| Immigrants | Taiwan | 100.0 /100 | #3 | Exceptional 23.9% |
| Filipinos | 100.0 /100 | #4 | Exceptional 24.3% |
| Immigrants | Hong Kong | 100.0 /100 | #5 | Exceptional 24.4% |
| Thais | 100.0 /100 | #6 | Exceptional 24.5% |
| Chinese | 100.0 /100 | #7 | Exceptional 24.6% |
| Immigrants | Iran | 100.0 /100 | #8 | Exceptional 25.1% |
| Immigrants | Lithuania | 100.0 /100 | #9 | Exceptional 25.2% |
| Immigrants | South Central Asia | 100.0 /100 | #10 | Exceptional 25.3% |
| Iranians | 100.0 /100 | #11 | Exceptional 25.5% |
| Bhutanese | 100.0 /100 | #12 | Exceptional 25.6% |
| Indians (Asian) | 100.0 /100 | #13 | Exceptional 25.8% |
| Immigrants | Singapore | 100.0 /100 | #14 | Exceptional 25.8% |
| Immigrants | Ireland | 100.0 /100 | #15 | Exceptional 25.8% |
Demographics Similar to Immigrants from Turkey by Single Mother Poverty
In terms of single mother poverty, the demographic groups most similar to Immigrants from Turkey are Soviet Union (27.3%, a difference of 0.040%), Immigrants from Australia (27.3%, a difference of 0.060%), Russian (27.3%, a difference of 0.080%), Immigrants from Czechoslovakia (27.4%, a difference of 0.090%), and Immigrants from Northern Europe (27.3%, a difference of 0.11%).
| Demographics | Rating | Rank | Single Mother Poverty |
| Argentineans | 99.6 /100 | #58 | Exceptional 27.2% |
| Paraguayans | 99.6 /100 | #59 | Exceptional 27.2% |
| Eastern Europeans | 99.6 /100 | #60 | Exceptional 27.2% |
| Immigrants | Eastern Europe | 99.6 /100 | #61 | Exceptional 27.2% |
| Immigrants | Malaysia | 99.5 /100 | #62 | Exceptional 27.3% |
| Immigrants | Northern Europe | 99.5 /100 | #63 | Exceptional 27.3% |
| Russians | 99.5 /100 | #64 | Exceptional 27.3% |
| Immigrants | Turkey | 99.5 /100 | #65 | Exceptional 27.3% |
| Soviet Union | 99.5 /100 | #66 | Exceptional 27.3% |
| Immigrants | Australia | 99.5 /100 | #67 | Exceptional 27.3% |
| Immigrants | Czechoslovakia | 99.5 /100 | #68 | Exceptional 27.4% |
| Lithuanians | 99.4 /100 | #69 | Exceptional 27.4% |
| Immigrants | Belarus | 99.4 /100 | #70 | Exceptional 27.4% |
| Macedonians | 99.4 /100 | #71 | Exceptional 27.4% |
| Immigrants | Russia | 99.4 /100 | #72 | Exceptional 27.4% |