Assyrian/Chaldean/Syriac vs Cape Verdean Single Mother Poverty
COMPARE
Assyrian/Chaldean/Syriac
Cape Verdean
Single Mother Poverty
Single Mother Poverty Comparison
Assyrians/Chaldeans/Syriacs
Cape Verdeans
23.8%
SINGLE MOTHER POVERTY
100.0/ 100
METRIC RATING
1st/ 347
METRIC RANK
30.8%
SINGLE MOTHER POVERTY
0.8/ 100
METRIC RATING
249th/ 347
METRIC RANK
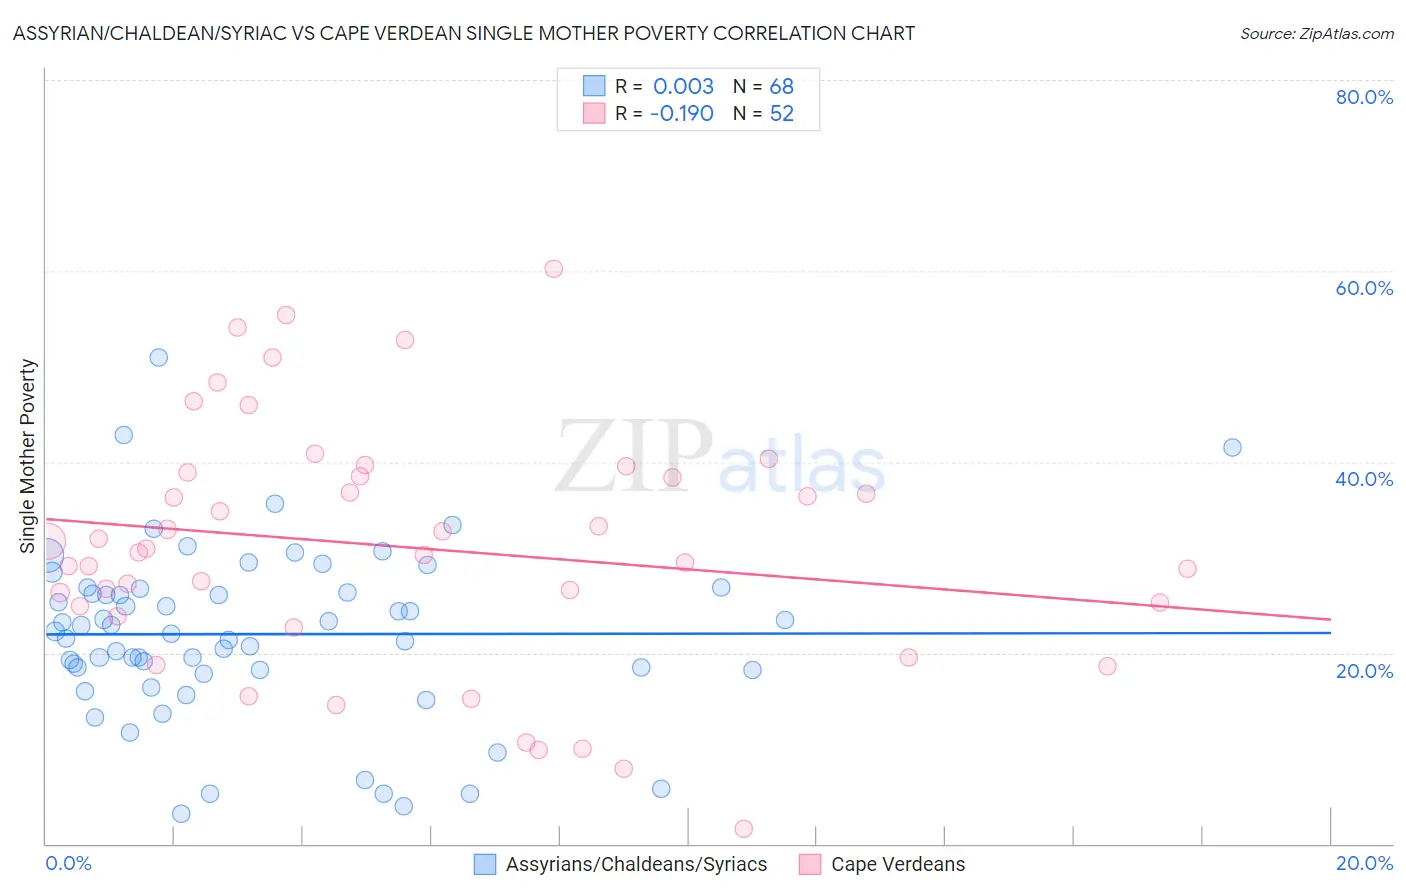
Assyrian/Chaldean/Syriac vs Cape Verdean Single Mother Poverty Correlation Chart
The statistical analysis conducted on geographies consisting of 109,112,991 people shows no correlation between the proportion of Assyrians/Chaldeans/Syriacs and poverty level among single mothers in the United States with a correlation coefficient (R) of 0.003 and weighted average of 23.8%. Similarly, the statistical analysis conducted on geographies consisting of 106,661,229 people shows a poor negative correlation between the proportion of Cape Verdeans and poverty level among single mothers in the United States with a correlation coefficient (R) of -0.190 and weighted average of 30.8%, a difference of 29.6%.
Single Mother Poverty Correlation Summary
| Measurement | Assyrian/Chaldean/Syriac | Cape Verdean |
| Minimum | 3.1% | 1.6% |
| Maximum | 50.9% | 60.3% |
| Range | 47.8% | 58.7% |
| Mean | 22.0% | 31.1% |
| Median | 22.1% | 30.7% |
| Interquartile 25% (IQ1) | 18.2% | 24.4% |
| Interquartile 75% (IQ3) | 26.5% | 38.7% |
| Interquartile Range (IQR) | 8.3% | 14.3% |
| Standard Deviation (Sample) | 9.1% | 12.9% |
| Standard Deviation (Population) | 9.0% | 12.8% |
Similar Demographics by Single Mother Poverty
Demographics Similar to Assyrians/Chaldeans/Syriacs by Single Mother Poverty
In terms of single mother poverty, the demographic groups most similar to Assyrians/Chaldeans/Syriacs are Immigrants from India (23.8%, a difference of 0.020%), Immigrants from Taiwan (23.9%, a difference of 0.21%), Filipino (24.3%, a difference of 2.1%), Immigrants from Hong Kong (24.4%, a difference of 2.4%), and Thai (24.5%, a difference of 2.9%).
| Demographics | Rating | Rank | Single Mother Poverty |
| Assyrians/Chaldeans/Syriacs | 100.0 /100 | #1 | Exceptional 23.8% |
| Immigrants | India | 100.0 /100 | #2 | Exceptional 23.8% |
| Immigrants | Taiwan | 100.0 /100 | #3 | Exceptional 23.9% |
| Filipinos | 100.0 /100 | #4 | Exceptional 24.3% |
| Immigrants | Hong Kong | 100.0 /100 | #5 | Exceptional 24.4% |
| Thais | 100.0 /100 | #6 | Exceptional 24.5% |
| Chinese | 100.0 /100 | #7 | Exceptional 24.6% |
| Immigrants | Iran | 100.0 /100 | #8 | Exceptional 25.1% |
| Immigrants | Lithuania | 100.0 /100 | #9 | Exceptional 25.2% |
| Immigrants | South Central Asia | 100.0 /100 | #10 | Exceptional 25.3% |
| Iranians | 100.0 /100 | #11 | Exceptional 25.5% |
| Bhutanese | 100.0 /100 | #12 | Exceptional 25.6% |
| Indians (Asian) | 100.0 /100 | #13 | Exceptional 25.8% |
| Immigrants | Singapore | 100.0 /100 | #14 | Exceptional 25.8% |
| Immigrants | Ireland | 100.0 /100 | #15 | Exceptional 25.8% |
Demographics Similar to Cape Verdeans by Single Mother Poverty
In terms of single mother poverty, the demographic groups most similar to Cape Verdeans are French Canadian (30.8%, a difference of 0.080%), West Indian (30.8%, a difference of 0.12%), Ecuadorian (30.8%, a difference of 0.15%), Vietnamese (30.9%, a difference of 0.15%), and Tlingit-Haida (30.9%, a difference of 0.27%).
| Demographics | Rating | Rank | Single Mother Poverty |
| Immigrants | Burma/Myanmar | 1.7 /100 | #242 | Tragic 30.6% |
| Bermudans | 1.6 /100 | #243 | Tragic 30.6% |
| French | 1.3 /100 | #244 | Tragic 30.7% |
| Barbadians | 1.3 /100 | #245 | Tragic 30.7% |
| Ecuadorians | 0.9 /100 | #246 | Tragic 30.8% |
| West Indians | 0.9 /100 | #247 | Tragic 30.8% |
| French Canadians | 0.9 /100 | #248 | Tragic 30.8% |
| Cape Verdeans | 0.8 /100 | #249 | Tragic 30.8% |
| Vietnamese | 0.7 /100 | #250 | Tragic 30.9% |
| Tlingit-Haida | 0.6 /100 | #251 | Tragic 30.9% |
| Alaska Natives | 0.6 /100 | #252 | Tragic 30.9% |
| Celtics | 0.6 /100 | #253 | Tragic 30.9% |
| Senegalese | 0.5 /100 | #254 | Tragic 31.0% |
| Belizeans | 0.5 /100 | #255 | Tragic 31.0% |
| Immigrants | West Indies | 0.4 /100 | #256 | Tragic 31.1% |