Assyrian/Chaldean/Syriac vs Immigrants from Northern Africa Child Poverty Among Girls Under 16

COMPARE

Assyrian/Chaldean/Syriac
Race
Ancestry
AfghanAfricanAlaska NativeAlaskan AthabascanAlbanianAleutAlsatianAmericanApacheArabArapahoArgentineanArmenianAssyrian/Chaldean/SyriacAustralianAustrianBahamianBangladeshiBarbadianBasqueBelgianBelizeanBermudanBhutaneseBlackfeetBolivianBrazilianBritishBritish West IndianBulgarianBurmeseCajunCambodianCanadianCape VerdeanCarpatho RusynCelticCentral AmericanCentral American IndianCherokeeCheyenneChickasawChileanChineseChippewaChoctawColombianColvilleComancheCosta RicanCreeCreekCroatianCrowCubanCypriotCzechCzechoslovakianDanishDelawareDominicanDutchDutch West IndianEastern EuropeanEcuadorianEgyptianEnglishEstonianEthiopianEuropeanFijianFilipinoFinnishFrenchFrench American IndianFrench CanadianGermanGerman RussianGhanaianGreekGuamanian/ChamorroGuatemalanGuyaneseHaitianHmongHonduranHopiHoumaHungarianIcelanderIndian (Asian)IndonesianInupiatIranianIraqiIrishIroquoisIsraeliItalianJamaicanJapaneseJordanianKenyanKiowaKoreanLaotianLatvianLebaneseLiberianLithuanianLumbeeLuxembourgerMacedonianMalaysianMalteseMarshalleseMenomineeMexicanMexican American IndianMongolianMoroccanNative HawaiianNavajoNepaleseNew ZealanderNicaraguanNigerianNorthern EuropeanNorwegianOkinawanOsageOttawaPaiutePakistaniPalestinianPanamanianParaguayanPennsylvania GermanPeruvianPimaPolishPortuguesePotawatomiPuebloPuerto RicanPuget Sound SalishRomanianRussianSalvadoranSamoanScandinavianScotch-IrishScottishSeminoleSenegaleseSerbianShoshoneSierra LeoneanSiouxSlavicSlovakSloveneSomaliSouth AfricanSouth AmericanSouth American IndianSoviet UnionSpaniardSpanishSpanish AmericanSpanish American IndianSri LankanSubsaharan AfricanSudaneseSwedishSwissSyrianTaiwaneseThaiTlingit-HaidaTohono O'OdhamTonganTrinidadian and TobagonianTsimshianTurkishU.S. Virgin IslanderUgandanUkrainianUruguayanUteVenezuelanVietnameseWelshWest IndianYakamaYaquiYugoslavianYumanYup'ikZimbabwean
Immigration
NonimmigrantsImmigrantsAfghanistanAfricaAlbaniaArgentinaArmeniaAsiaAustraliaAustriaBahamasBangladeshBarbadosBelarusBelgiumBelizeBoliviaBosnia and HerzegovinaBrazilBulgariaBurma/MyanmarCabo VerdeCambodiaCameroonCanadaCaribbeanCentral AmericaChileChinaColombiaCongoCosta RicaCroatiaCubaCzechoslovakiaDenmarkDominicaDominican RepublicEastern AfricaEastern AsiaEastern EuropeEcuadorEgyptEl SalvadorEnglandEritreaEthiopiaEuropeFijiFranceGermanyGhanaGreeceGrenadaGuatemalaGuyanaHaitiHondurasHong KongHungaryIndiaIndonesiaIranIraqIrelandIsraelItalyJamaicaJapanJordanKazakhstanKenyaKoreaKuwaitLaosLatin AmericaLatviaLebanonLiberiaLithuaniaMalaysiaMexicoMicronesiaMiddle AfricaMoldovaMoroccoNepalNetherlandsNicaraguaNigeriaNorth AmericaNorth MacedoniaNorthern EuropeNorwayOceaniaPakistanPanamaPeruPhilippinesPolandPortugalRomaniaRussiaSaudi ArabiaScotlandSenegalSerbiaSierra LeoneSingaporeSomaliaSouth AfricaSouth AmericaSouth Central AsiaSouth Eastern AsiaSouthern EuropeSpainSri LankaSt. Vincent and the GrenadinesSudanSwedenSwitzerlandSyriaTaiwanThailandTrinidad and TobagoTurkeyUgandaUkraineUruguayUzbekistanVenezuelaVietnamWest IndiesWestern AfricaWestern AsiaWestern EuropeYemenZaireZimbabweAzores
Immigrants from Northern Africa
Race
Ancestry
AfghanAfricanAlaska NativeAlaskan AthabascanAlbanianAleutAlsatianAmericanApacheArabArapahoArgentineanArmenianAustralianAustrianBahamianBangladeshiBarbadianBasqueBelgianBelizeanBermudanBhutaneseBlackfeetBolivianBrazilianBritishBritish West IndianBulgarianBurmeseCajunCambodianCanadianCape VerdeanCarpatho RusynCelticCentral AmericanCentral American IndianCherokeeCheyenneChickasawChileanChineseChippewaChoctawColombianColvilleComancheCosta RicanCreeCreekCroatianCrowCubanCypriotCzechCzechoslovakianDanishDelawareDominicanDutchDutch West IndianEastern EuropeanEcuadorianEgyptianEnglishEstonianEthiopianEuropeanFijianFilipinoFinnishFrenchFrench American IndianFrench CanadianGermanGerman RussianGhanaianGreekGuamanian/ChamorroGuatemalanGuyaneseHaitianHmongHonduranHopiHoumaHungarianIcelanderIndian (Asian)IndonesianInupiatIranianIraqiIrishIroquoisIsraeliItalianJamaicanJapaneseJordanianKenyanKiowaKoreanLaotianLatvianLebaneseLiberianLithuanianLumbeeLuxembourgerMacedonianMalaysianMalteseMarshalleseMenomineeMexicanMexican American IndianMongolianMoroccanNative HawaiianNavajoNepaleseNew ZealanderNicaraguanNigerianNorthern EuropeanNorwegianOkinawanOsageOttawaPaiutePakistaniPalestinianPanamanianParaguayanPennsylvania GermanPeruvianPimaPolishPortuguesePotawatomiPuebloPuerto RicanPuget Sound SalishRomanianRussianSalvadoranSamoanScandinavianScotch-IrishScottishSeminoleSenegaleseSerbianShoshoneSierra LeoneanSiouxSlavicSlovakSloveneSomaliSouth AfricanSouth AmericanSouth American IndianSoviet UnionSpaniardSpanishSpanish AmericanSpanish American IndianSri LankanSubsaharan AfricanSudaneseSwedishSwissSyrianTaiwaneseThaiTlingit-HaidaTohono O'OdhamTonganTrinidadian and TobagonianTsimshianTurkishU.S. Virgin IslanderUgandanUkrainianUruguayanUteVenezuelanVietnameseWelshWest IndianYakamaYaquiYugoslavianYumanYup'ikZimbabwean
Immigration
NonimmigrantsImmigrantsAfghanistanAfricaAlbaniaArgentinaArmeniaAsiaAustraliaAustriaBahamasBangladeshBarbadosBelarusBelgiumBelizeBoliviaBosnia and HerzegovinaBrazilBulgariaBurma/MyanmarCabo VerdeCambodiaCameroonCanadaCaribbeanCentral AmericaChileChinaColombiaCongoCosta RicaCroatiaCubaCzechoslovakiaDenmarkDominicaDominican RepublicEastern AfricaEastern AsiaEastern EuropeEcuadorEgyptEl SalvadorEnglandEritreaEthiopiaEuropeFijiFranceGermanyGhanaGreeceGrenadaGuatemalaGuyanaHaitiHondurasHong KongHungaryIndiaIndonesiaIranIraqIrelandIsraelItalyJamaicaJapanJordanKazakhstanKenyaKoreaKuwaitLaosLatin AmericaLatviaLebanonLiberiaLithuaniaMalaysiaMexicoMicronesiaMiddle AfricaMoldovaMoroccoNepalNetherlandsNicaraguaNigeriaNorth AmericaNorth MacedoniaNorthern AfricaNorthern EuropeNorwayOceaniaPakistanPanamaPeruPhilippinesPolandPortugalRomaniaRussiaSaudi ArabiaScotlandSenegalSerbiaSierra LeoneSingaporeSomaliaSouth AfricaSouth AmericaSouth Central AsiaSouth Eastern AsiaSouthern EuropeSpainSri LankaSt. Vincent and the GrenadinesSudanSwedenSwitzerlandSyriaTaiwanThailandTrinidad and TobagoTurkeyUgandaUkraineUruguayUzbekistanVenezuelaVietnamWest IndiesWestern AfricaWestern AsiaWestern EuropeYemenZaireZimbabweAzores
Child Poverty Among Girls Under 16
Income
Poverty
Unemployment
Labor Participation
Family Structure
Vehicle Availability
Education Level
Disability

Child Poverty Among Girls Under 16 Comparison

Assyrians/Chaldeans/Syriacs

Immigrants from Northern Africa

Exceptional
Good
13.3%
CHILD POVERTY AMONG GIRLS UNDER 16
99.9/ 100
METRIC RATING
21st/ 347
METRIC RANK
16.0%
CHILD POVERTY AMONG GIRLS UNDER 16
72.0/ 100
METRIC RATING
161st/ 347
METRIC RANK

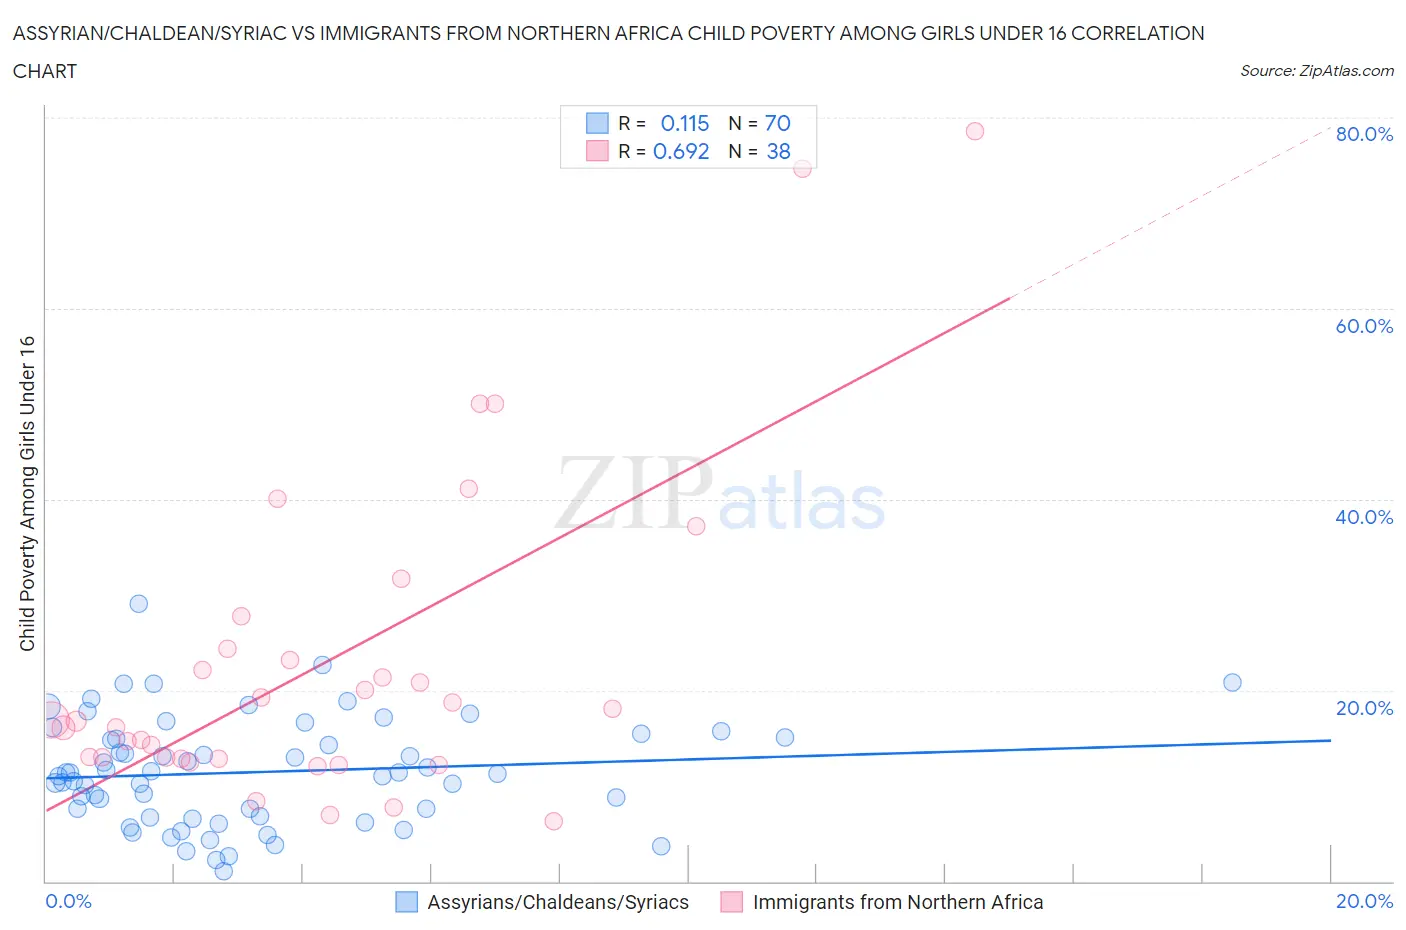
Assyrian/Chaldean/Syriac vs Immigrants from Northern Africa Child Poverty Among Girls Under 16 Correlation Chart

The statistical analysis conducted on geographies consisting of 109,412,963 people shows a poor positive correlation between the proportion of Assyrians/Chaldeans/Syriacs and poverty level among girls under the age of 16 in the United States with a correlation coefficient (R) of 0.115 and weighted average of 13.3%. Similarly, the statistical analysis conducted on geographies consisting of 316,657,809 people shows a significant positive correlation between the proportion of Immigrants from Northern Africa and poverty level among girls under the age of 16 in the United States with a correlation coefficient (R) of 0.692 and weighted average of 16.0%, a difference of 20.5%.
Assyrian/Chaldean/Syriac vs Immigrants from Northern Africa Child Poverty Among Girls Under 16

Child Poverty Among Girls Under 16 Correlation Summary

MeasurementAssyrian/Chaldean/SyriacImmigrants from Northern Africa
Minimum1.1%6.2%
Maximum29.1%78.6%
Range28.0%72.3%
Mean11.4%22.9%
Median11.3%16.8%
Interquartile 25% (IQ1)6.8%12.8%
Interquartile 75% (IQ3)15.0%24.4%
Interquartile Range (IQR)8.3%11.6%
Standard Deviation (Sample)5.6%16.9%
Standard Deviation (Population)5.5%16.7%

Similar Demographics by Child Poverty Among Girls Under 16

Demographics Similar to Assyrians/Chaldeans/Syriacs by Child Poverty Among Girls Under 16

In terms of child poverty among girls under 16, the demographic groups most similar to Assyrians/Chaldeans/Syriacs are Immigrants from Japan (13.3%, a difference of 0.12%), Indian (Asian) (13.3%, a difference of 0.20%), Norwegian (13.3%, a difference of 0.37%), Immigrants from Eastern Asia (13.4%, a difference of 0.46%), and Cypriot (13.2%, a difference of 0.78%).
DemographicsRating | RankChild Poverty Among Girls Under 16
Burmese
99.9
/100
|
#14
Exceptional
13.0%
Okinawans
99.9
/100
|
#15
Exceptional
13.0%
Immigrants | Lithuania
99.9
/100
|
#16
Exceptional
13.1%
Bulgarians
99.9
/100
|
#17
Exceptional
13.1%
Immigrants | Korea
99.9
/100
|
#18
Exceptional
13.1%
Cypriots
99.9
/100
|
#19
Exceptional
13.2%
Immigrants | Japan
99.9
/100
|
#20
Exceptional
13.3%
Assyrians/Chaldeans/Syriacs
99.9
/100
|
#21
Exceptional
13.3%
Indians (Asian)
99.9
/100
|
#22
Exceptional
13.3%
Norwegians
99.9
/100
|
#23
Exceptional
13.3%
Immigrants | Eastern Asia
99.9
/100
|
#24
Exceptional
13.4%
Immigrants | China
99.8
/100
|
#25
Exceptional
13.4%
Eastern Europeans
99.8
/100
|
#26
Exceptional
13.5%
Latvians
99.8
/100
|
#27
Exceptional
13.5%
Tongans
99.8
/100
|
#28
Exceptional
13.6%

Demographics Similar to Immigrants from Northern Africa by Child Poverty Among Girls Under 16

In terms of child poverty among girls under 16, the demographic groups most similar to Immigrants from Northern Africa are French (16.0%, a difference of 0.11%), French Canadian (16.1%, a difference of 0.47%), Slovak (15.9%, a difference of 0.49%), Guamanian/Chamorro (15.9%, a difference of 0.50%), and Immigrants from Oceania (16.1%, a difference of 0.52%).
DemographicsRating | RankChild Poverty Among Girls Under 16
Immigrants | Chile
76.7
/100
|
#154
Good
15.9%
Syrians
76.7
/100
|
#155
Good
15.9%
Immigrants | Fiji
76.1
/100
|
#156
Good
15.9%
Colombians
76.1
/100
|
#157
Good
15.9%
Guamanians/Chamorros
75.3
/100
|
#158
Good
15.9%
Slovaks
75.2
/100
|
#159
Good
15.9%
French
72.8
/100
|
#160
Good
16.0%
Immigrants | Northern Africa
72.0
/100
|
#161
Good
16.0%
French Canadians
68.7
/100
|
#162
Good
16.1%
Immigrants | Oceania
68.4
/100
|
#163
Good
16.1%
Immigrants | Colombia
67.8
/100
|
#164
Good
16.1%
Immigrants | Germany
67.3
/100
|
#165
Good
16.1%
South Americans
67.2
/100
|
#166
Good
16.1%
Uruguayans
64.7
/100
|
#167
Good
16.2%
Yugoslavians
64.4
/100
|
#168
Good
16.2%