Armenian vs Immigrants from Northern Europe Female Poverty
COMPARE
Armenian
Immigrants from Northern Europe
Female Poverty
Female Poverty Comparison
Armenians
Immigrants from Northern Europe
13.2%
FEMALE POVERTY
70.4/ 100
METRIC RATING
154th/ 347
METRIC RANK
11.6%
FEMALE POVERTY
99.6/ 100
METRIC RATING
25th/ 347
METRIC RANK
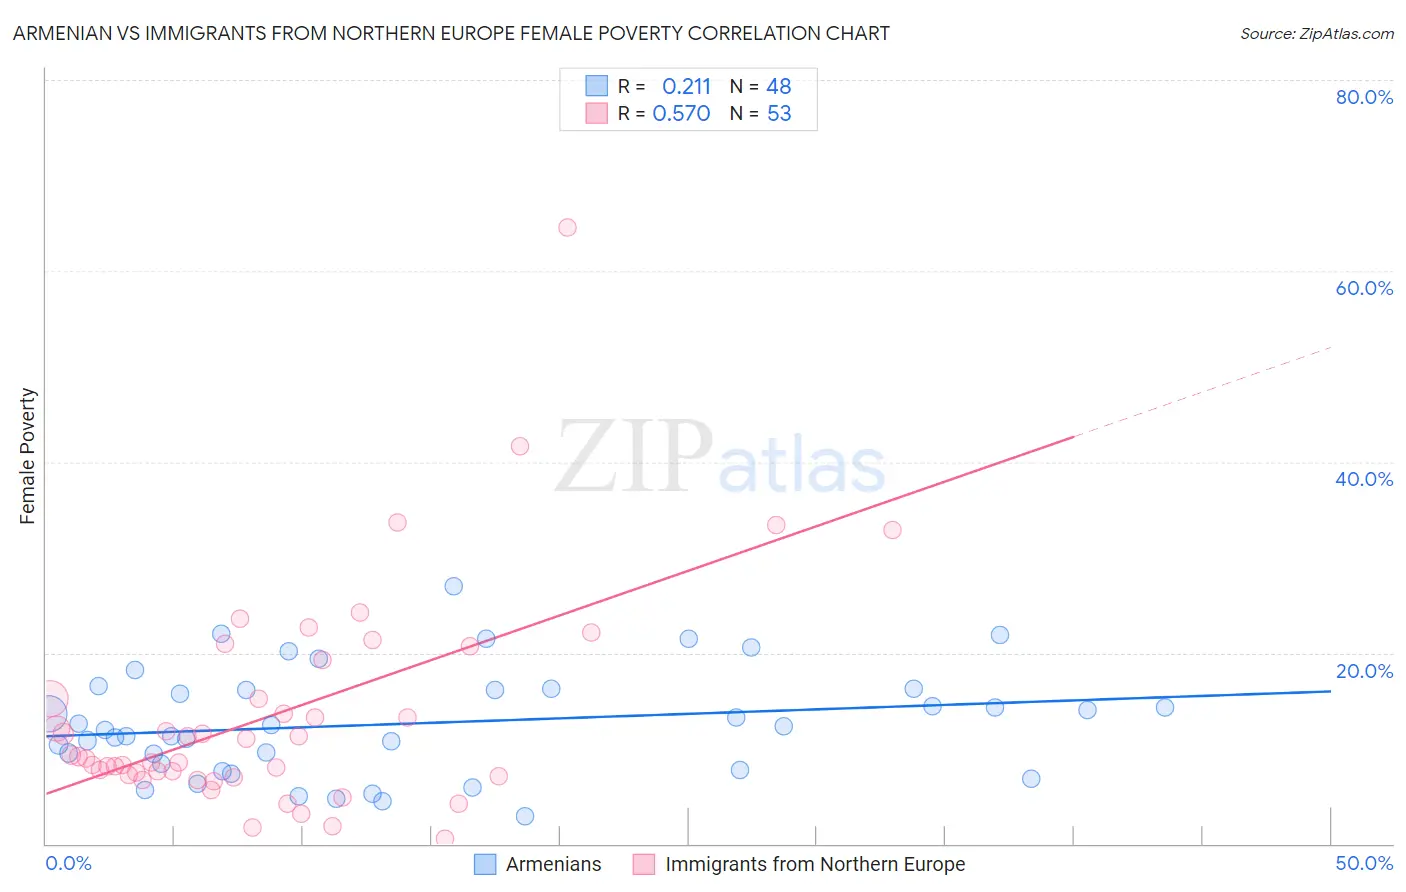
Armenian vs Immigrants from Northern Europe Female Poverty Correlation Chart
The statistical analysis conducted on geographies consisting of 310,749,032 people shows a weak positive correlation between the proportion of Armenians and poverty level among females in the United States with a correlation coefficient (R) of 0.211 and weighted average of 13.2%. Similarly, the statistical analysis conducted on geographies consisting of 476,749,265 people shows a substantial positive correlation between the proportion of Immigrants from Northern Europe and poverty level among females in the United States with a correlation coefficient (R) of 0.570 and weighted average of 11.6%, a difference of 13.1%.
Female Poverty Correlation Summary
| Measurement | Armenian | Immigrants from Northern Europe |
| Minimum | 2.9% | 0.47% |
| Maximum | 26.9% | 64.6% |
| Range | 24.0% | 64.1% |
| Mean | 12.6% | 13.5% |
| Median | 12.1% | 9.1% |
| Interquartile 25% (IQ1) | 8.0% | 7.2% |
| Interquartile 75% (IQ3) | 16.2% | 17.2% |
| Interquartile Range (IQR) | 8.1% | 10.1% |
| Standard Deviation (Sample) | 5.6% | 11.4% |
| Standard Deviation (Population) | 5.5% | 11.3% |
Similar Demographics by Female Poverty
Demographics Similar to Armenians by Female Poverty
In terms of female poverty, the demographic groups most similar to Armenians are Hungarian (13.2%, a difference of 0.040%), Immigrants from Fiji (13.2%, a difference of 0.070%), Immigrants from Bosnia and Herzegovina (13.2%, a difference of 0.090%), Immigrants from Northern Africa (13.2%, a difference of 0.19%), and Pennsylvania German (13.2%, a difference of 0.36%).
| Demographics | Rating | Rank | Female Poverty |
| Immigrants | Kazakhstan | 78.6 /100 | #147 | Good 13.0% |
| Yugoslavians | 76.9 /100 | #148 | Good 13.1% |
| Taiwanese | 75.7 /100 | #149 | Good 13.1% |
| Tsimshian | 75.5 /100 | #150 | Good 13.1% |
| Immigrants | Germany | 74.9 /100 | #151 | Good 13.1% |
| Samoans | 73.6 /100 | #152 | Good 13.1% |
| Immigrants | Fiji | 71.0 /100 | #153 | Good 13.2% |
| Armenians | 70.4 /100 | #154 | Good 13.2% |
| Hungarians | 70.1 /100 | #155 | Good 13.2% |
| Immigrants | Bosnia and Herzegovina | 69.7 /100 | #156 | Good 13.2% |
| Immigrants | Northern Africa | 68.8 /100 | #157 | Good 13.2% |
| Pennsylvania Germans | 67.3 /100 | #158 | Good 13.2% |
| Costa Ricans | 63.6 /100 | #159 | Good 13.3% |
| Immigrants | Nepal | 62.7 /100 | #160 | Good 13.3% |
| Immigrants | Ethiopia | 62.5 /100 | #161 | Good 13.3% |
Demographics Similar to Immigrants from Northern Europe by Female Poverty
In terms of female poverty, the demographic groups most similar to Immigrants from Northern Europe are Croatian (11.6%, a difference of 0.0%), Iranian (11.7%, a difference of 0.11%), Luxembourger (11.6%, a difference of 0.26%), Burmese (11.6%, a difference of 0.28%), and Immigrants from Korea (11.7%, a difference of 0.32%).
| Demographics | Rating | Rank | Female Poverty |
| Immigrants | Scotland | 99.8 /100 | #18 | Exceptional 11.5% |
| Norwegians | 99.8 /100 | #19 | Exceptional 11.5% |
| Eastern Europeans | 99.7 /100 | #20 | Exceptional 11.5% |
| Italians | 99.7 /100 | #21 | Exceptional 11.6% |
| Swedes | 99.7 /100 | #22 | Exceptional 11.6% |
| Burmese | 99.7 /100 | #23 | Exceptional 11.6% |
| Luxembourgers | 99.7 /100 | #24 | Exceptional 11.6% |
| Immigrants | Northern Europe | 99.6 /100 | #25 | Exceptional 11.6% |
| Croatians | 99.6 /100 | #26 | Exceptional 11.6% |
| Iranians | 99.6 /100 | #27 | Exceptional 11.7% |
| Immigrants | Korea | 99.6 /100 | #28 | Exceptional 11.7% |
| Immigrants | North Macedonia | 99.6 /100 | #29 | Exceptional 11.7% |
| Greeks | 99.5 /100 | #30 | Exceptional 11.7% |
| Poles | 99.5 /100 | #31 | Exceptional 11.7% |
| Danes | 99.5 /100 | #32 | Exceptional 11.7% |