Arapaho vs Costa Rican Child Poverty Under the Age of 16
COMPARE
Arapaho
Costa Rican
Child Poverty Under the Age of 16
Child Poverty Under the Age of 16 Comparison
Arapaho
Costa Ricans
20.8%
CHILD POVERTY UNDER THE AGE OF 16
0.0/ 100
METRIC RATING
298th/ 347
METRIC RANK
16.0%
CHILD POVERTY UNDER THE AGE OF 16
61.1/ 100
METRIC RATING
167th/ 347
METRIC RANK
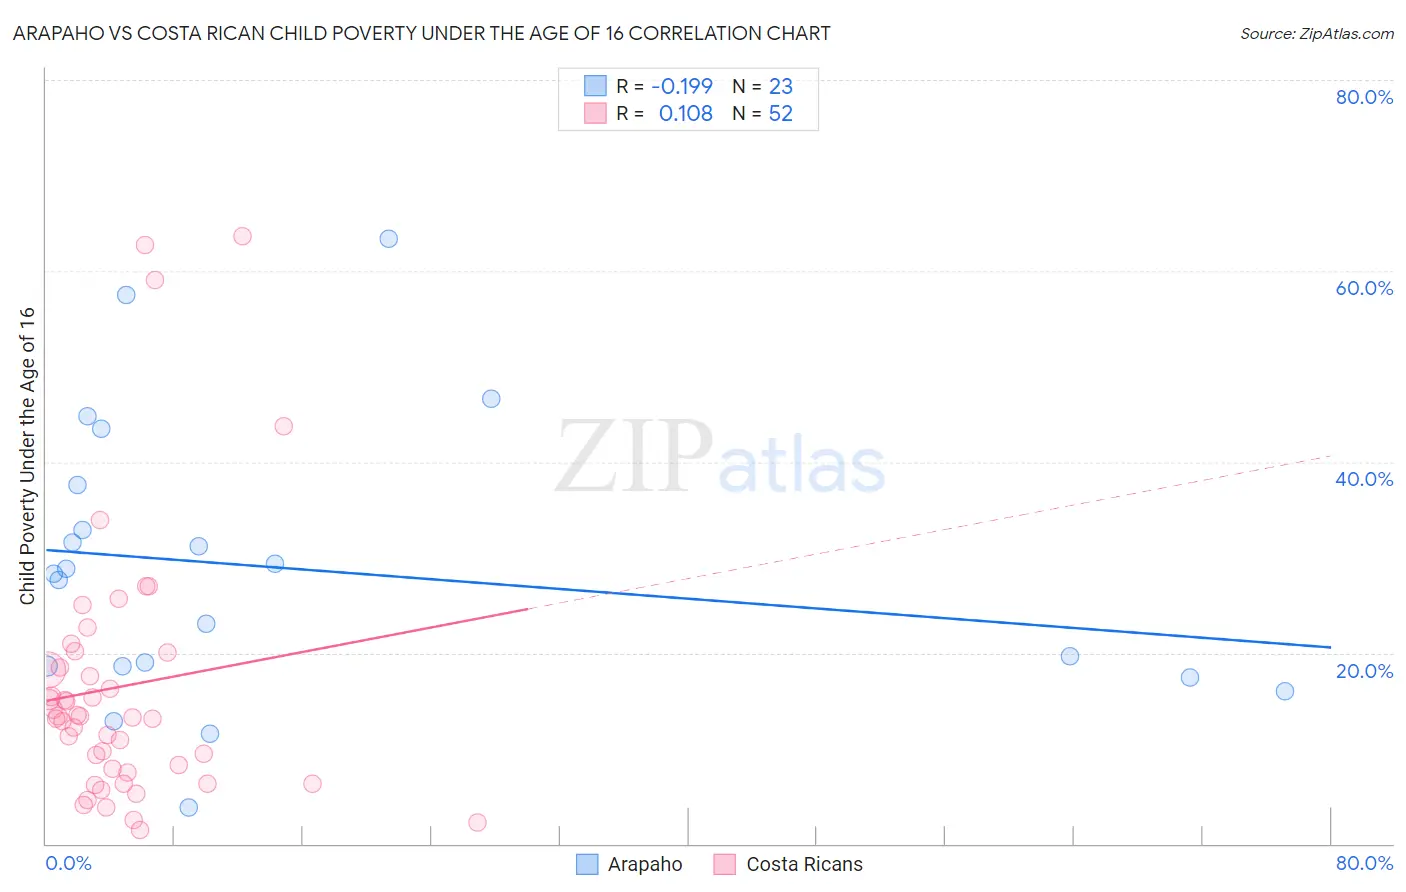
Arapaho vs Costa Rican Child Poverty Under the Age of 16 Correlation Chart
The statistical analysis conducted on geographies consisting of 29,725,461 people shows a poor negative correlation between the proportion of Arapaho and poverty level among children under the age of 16 in the United States with a correlation coefficient (R) of -0.199 and weighted average of 20.8%. Similarly, the statistical analysis conducted on geographies consisting of 252,372,287 people shows a poor positive correlation between the proportion of Costa Ricans and poverty level among children under the age of 16 in the United States with a correlation coefficient (R) of 0.108 and weighted average of 16.0%, a difference of 30.1%.
Child Poverty Under the Age of 16 Correlation Summary
| Measurement | Arapaho | Costa Rican |
| Minimum | 3.7% | 1.5% |
| Maximum | 63.3% | 63.6% |
| Range | 59.6% | 62.2% |
| Mean | 28.8% | 16.5% |
| Median | 28.3% | 13.3% |
| Interquartile 25% (IQ1) | 18.5% | 7.7% |
| Interquartile 75% (IQ3) | 37.6% | 19.2% |
| Interquartile Range (IQR) | 19.1% | 11.6% |
| Standard Deviation (Sample) | 14.8% | 14.0% |
| Standard Deviation (Population) | 14.5% | 13.9% |
Similar Demographics by Child Poverty Under the Age of 16
Demographics Similar to Arapaho by Child Poverty Under the Age of 16
In terms of child poverty under the age of 16, the demographic groups most similar to Arapaho are Hispanic or Latino (20.8%, a difference of 0.0%), Immigrants from Caribbean (20.8%, a difference of 0.13%), Immigrants from Haiti (20.9%, a difference of 0.30%), Mexican (20.7%, a difference of 0.51%), and Haitian (20.7%, a difference of 0.65%).
| Demographics | Rating | Rank | Child Poverty Under the Age of 16 |
| Chippewa | 0.0 /100 | #291 | Tragic 20.5% |
| Immigrants | Latin America | 0.0 /100 | #292 | Tragic 20.5% |
| Immigrants | Senegal | 0.0 /100 | #293 | Tragic 20.6% |
| Haitians | 0.0 /100 | #294 | Tragic 20.7% |
| Mexicans | 0.0 /100 | #295 | Tragic 20.7% |
| Immigrants | Caribbean | 0.0 /100 | #296 | Tragic 20.8% |
| Hispanics or Latinos | 0.0 /100 | #297 | Tragic 20.8% |
| Arapaho | 0.0 /100 | #298 | Tragic 20.8% |
| Immigrants | Haiti | 0.0 /100 | #299 | Tragic 20.9% |
| Indonesians | 0.0 /100 | #300 | Tragic 21.0% |
| Immigrants | Grenada | 0.0 /100 | #301 | Tragic 21.0% |
| Immigrants | Bahamas | 0.0 /100 | #302 | Tragic 21.0% |
| Choctaw | 0.0 /100 | #303 | Tragic 21.0% |
| Somalis | 0.0 /100 | #304 | Tragic 21.0% |
| Seminole | 0.0 /100 | #305 | Tragic 21.1% |
Demographics Similar to Costa Ricans by Child Poverty Under the Age of 16
In terms of child poverty under the age of 16, the demographic groups most similar to Costa Ricans are South American (16.0%, a difference of 0.40%), Immigrants from Oceania (15.9%, a difference of 0.57%), Guamanian/Chamorro (15.9%, a difference of 0.70%), Uruguayan (16.1%, a difference of 0.80%), and Immigrants from Germany (15.8%, a difference of 0.84%).
| Demographics | Rating | Rank | Child Poverty Under the Age of 16 |
| Immigrants | Albania | 70.7 /100 | #160 | Good 15.8% |
| Immigrants | Northern Africa | 68.1 /100 | #161 | Good 15.8% |
| Colombians | 67.6 /100 | #162 | Good 15.8% |
| Yugoslavians | 67.6 /100 | #163 | Good 15.8% |
| Immigrants | Germany | 67.3 /100 | #164 | Good 15.8% |
| Guamanians/Chamorros | 66.4 /100 | #165 | Good 15.9% |
| Immigrants | Oceania | 65.4 /100 | #166 | Good 15.9% |
| Costa Ricans | 61.1 /100 | #167 | Good 16.0% |
| South Americans | 57.9 /100 | #168 | Average 16.0% |
| Uruguayans | 54.7 /100 | #169 | Average 16.1% |
| Immigrants | Colombia | 54.4 /100 | #170 | Average 16.1% |
| Hungarians | 52.5 /100 | #171 | Average 16.2% |
| Afghans | 52.3 /100 | #172 | Average 16.2% |
| Immigrants | Saudi Arabia | 52.1 /100 | #173 | Average 16.2% |
| Whites/Caucasians | 50.0 /100 | #174 | Average 16.2% |