Arab vs Immigrants from Costa Rica Single Female Poverty
COMPARE
Arab
Immigrants from Costa Rica
Single Female Poverty
Single Female Poverty Comparison
Arabs
Immigrants from Costa Rica
20.7%
SINGLE FEMALE POVERTY
70.8/ 100
METRIC RATING
160th/ 347
METRIC RANK
20.9%
SINGLE FEMALE POVERTY
61.5/ 100
METRIC RATING
168th/ 347
METRIC RANK
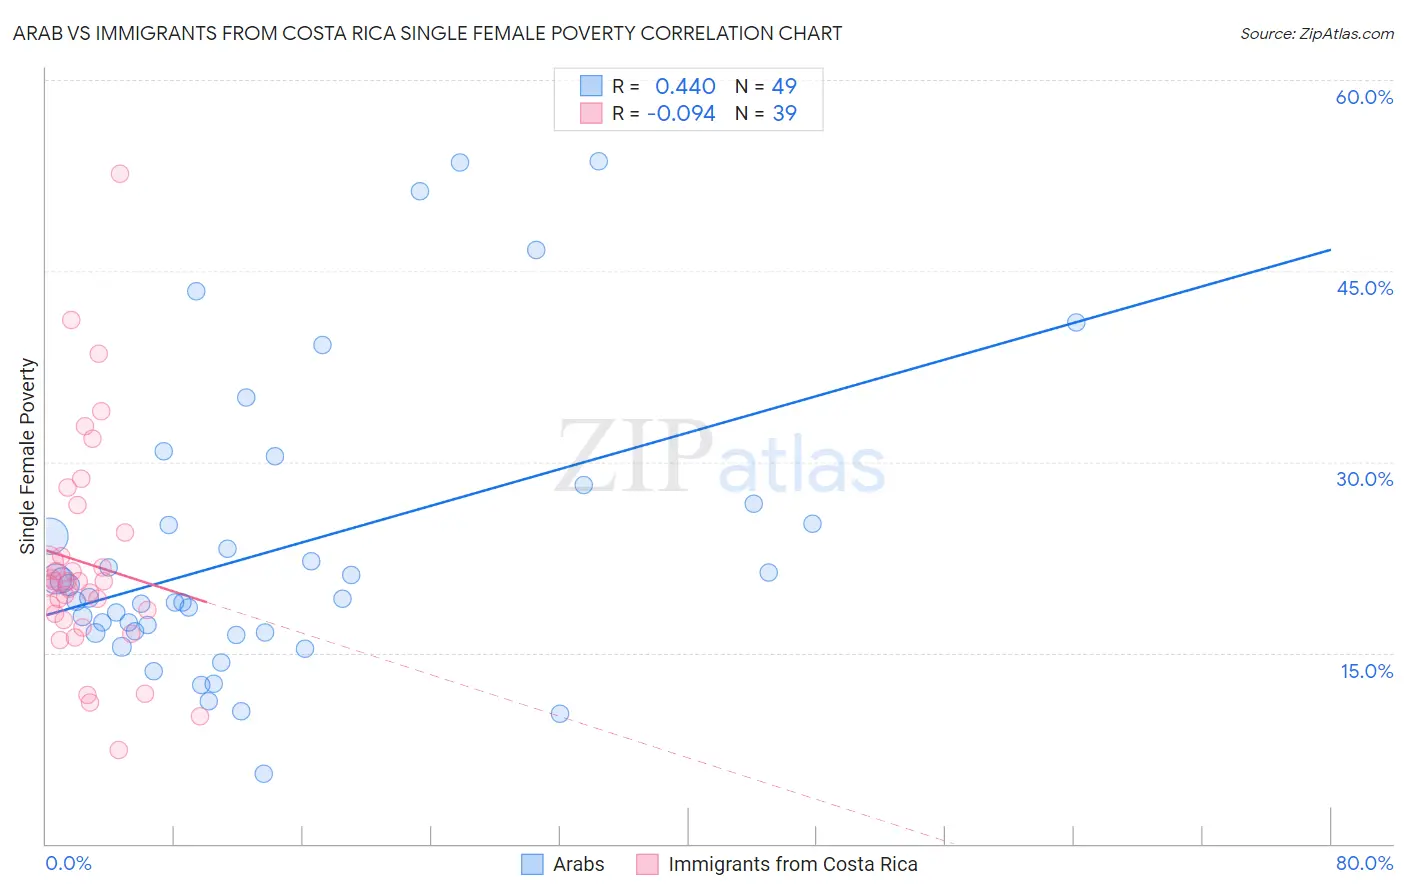
Arab vs Immigrants from Costa Rica Single Female Poverty Correlation Chart
The statistical analysis conducted on geographies consisting of 476,036,809 people shows a moderate positive correlation between the proportion of Arabs and poverty level among single females in the United States with a correlation coefficient (R) of 0.440 and weighted average of 20.7%. Similarly, the statistical analysis conducted on geographies consisting of 202,952,607 people shows a slight negative correlation between the proportion of Immigrants from Costa Rica and poverty level among single females in the United States with a correlation coefficient (R) of -0.094 and weighted average of 20.9%, a difference of 0.66%.
Single Female Poverty Correlation Summary
| Measurement | Arab | Immigrants from Costa Rica |
| Minimum | 5.5% | 7.4% |
| Maximum | 53.6% | 52.6% |
| Range | 48.1% | 45.2% |
| Mean | 23.1% | 22.0% |
| Median | 19.2% | 20.6% |
| Interquartile 25% (IQ1) | 16.6% | 17.6% |
| Interquartile 75% (IQ3) | 25.9% | 24.4% |
| Interquartile Range (IQR) | 9.4% | 6.8% |
| Standard Deviation (Sample) | 11.4% | 8.8% |
| Standard Deviation (Population) | 11.3% | 8.7% |
Demographics Similar to Arabs and Immigrants from Costa Rica by Single Female Poverty
In terms of single female poverty, the demographic groups most similar to Arabs are Costa Rican (20.7%, a difference of 0.080%), Danish (20.7%, a difference of 0.17%), Kenyan (20.8%, a difference of 0.18%), Northern European (20.8%, a difference of 0.18%), and Lebanese (20.8%, a difference of 0.24%). Similarly, the demographic groups most similar to Immigrants from Costa Rica are Immigrants from Norway (20.8%, a difference of 0.090%), Norwegian (20.8%, a difference of 0.10%), Ugandan (20.8%, a difference of 0.16%), Iraqi (20.8%, a difference of 0.20%), and Immigrants from Trinidad and Tobago (20.9%, a difference of 0.34%).
| Demographics | Rating | Rank | Single Female Poverty |
| Immigrants | Western Europe | 76.7 /100 | #154 | Good 20.6% |
| Samoans | 76.0 /100 | #155 | Good 20.6% |
| South American Indians | 75.7 /100 | #156 | Good 20.6% |
| Immigrants | Oceania | 74.3 /100 | #157 | Good 20.7% |
| Danes | 73.0 /100 | #158 | Good 20.7% |
| Costa Ricans | 71.8 /100 | #159 | Good 20.7% |
| Arabs | 70.8 /100 | #160 | Good 20.7% |
| Kenyans | 68.5 /100 | #161 | Good 20.8% |
| Northern Europeans | 68.4 /100 | #162 | Good 20.8% |
| Lebanese | 67.6 /100 | #163 | Good 20.8% |
| Iraqis | 64.5 /100 | #164 | Good 20.8% |
| Ugandans | 64.0 /100 | #165 | Good 20.8% |
| Norwegians | 63.0 /100 | #166 | Good 20.8% |
| Immigrants | Norway | 63.0 /100 | #167 | Good 20.8% |
| Immigrants | Costa Rica | 61.5 /100 | #168 | Good 20.9% |
| Immigrants | Trinidad and Tobago | 56.3 /100 | #169 | Average 20.9% |
| New Zealanders | 53.2 /100 | #170 | Average 21.0% |
| Moroccans | 52.8 /100 | #171 | Average 21.0% |
| Guyanese | 52.0 /100 | #172 | Average 21.0% |
| Immigrants | Guyana | 50.6 /100 | #173 | Average 21.0% |
| Cubans | 50.0 /100 | #174 | Average 21.0% |