American vs Immigrants from Syria Receiving Food Stamps
COMPARE
American
Immigrants from Syria
Receiving Food Stamps
Receiving Food Stamps Comparison
Americans
Immigrants from Syria
12.2%
RECEIVING FOOD STAMPS
26.7/ 100
METRIC RATING
195th/ 347
METRIC RANK
11.7%
RECEIVING FOOD STAMPS
53.4/ 100
METRIC RATING
173rd/ 347
METRIC RANK
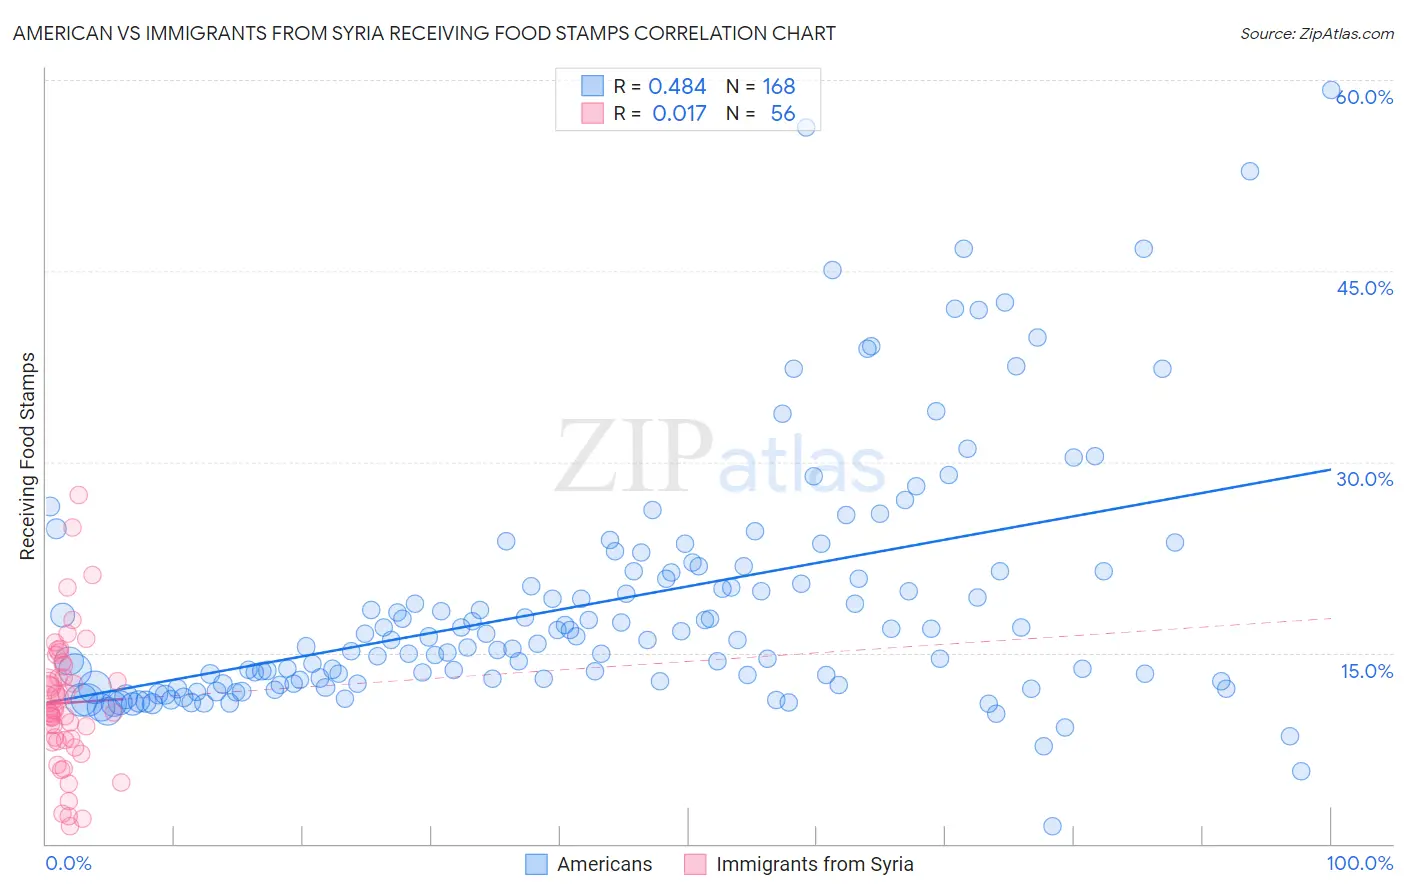
American vs Immigrants from Syria Receiving Food Stamps Correlation Chart
The statistical analysis conducted on geographies consisting of 578,010,429 people shows a moderate positive correlation between the proportion of Americans and percentage of population receiving government assistance and/or food stamps in the United States with a correlation coefficient (R) of 0.484 and weighted average of 12.2%. Similarly, the statistical analysis conducted on geographies consisting of 173,879,685 people shows no correlation between the proportion of Immigrants from Syria and percentage of population receiving government assistance and/or food stamps in the United States with a correlation coefficient (R) of 0.017 and weighted average of 11.7%, a difference of 4.0%.
Receiving Food Stamps Correlation Summary
| Measurement | American | Immigrants from Syria |
| Minimum | 1.4% | 1.4% |
| Maximum | 59.3% | 27.4% |
| Range | 57.9% | 26.0% |
| Mean | 18.9% | 11.1% |
| Median | 16.0% | 10.4% |
| Interquartile 25% (IQ1) | 12.6% | 8.1% |
| Interquartile 75% (IQ3) | 21.4% | 13.5% |
| Interquartile Range (IQR) | 8.8% | 5.5% |
| Standard Deviation (Sample) | 9.8% | 5.2% |
| Standard Deviation (Population) | 9.7% | 5.2% |
Similar Demographics by Receiving Food Stamps
Demographics Similar to Americans by Receiving Food Stamps
In terms of receiving food stamps, the demographic groups most similar to Americans are Iraqi (12.2%, a difference of 0.030%), Immigrants from Sudan (12.1%, a difference of 0.060%), Delaware (12.2%, a difference of 0.11%), Immigrants from Fiji (12.1%, a difference of 0.18%), and Immigrants from Costa Rica (12.2%, a difference of 0.24%).
| Demographics | Rating | Rank | Receiving Food Stamps |
| Sudanese | 33.4 /100 | #188 | Fair 12.0% |
| Immigrants | Cameroon | 32.5 /100 | #189 | Fair 12.0% |
| Immigrants | Peru | 32.2 /100 | #190 | Fair 12.0% |
| Venezuelans | 32.1 /100 | #191 | Fair 12.0% |
| Samoans | 31.0 /100 | #192 | Fair 12.1% |
| Immigrants | Fiji | 27.8 /100 | #193 | Fair 12.1% |
| Immigrants | Sudan | 27.1 /100 | #194 | Fair 12.1% |
| Americans | 26.7 /100 | #195 | Fair 12.2% |
| Iraqis | 26.6 /100 | #196 | Fair 12.2% |
| Delaware | 26.1 /100 | #197 | Fair 12.2% |
| Immigrants | Costa Rica | 25.4 /100 | #198 | Fair 12.2% |
| Portuguese | 25.1 /100 | #199 | Fair 12.2% |
| Sierra Leoneans | 23.6 /100 | #200 | Fair 12.2% |
| Ugandans | 22.5 /100 | #201 | Fair 12.2% |
| Immigrants | Venezuela | 20.1 /100 | #202 | Fair 12.3% |
Demographics Similar to Immigrants from Syria by Receiving Food Stamps
In terms of receiving food stamps, the demographic groups most similar to Immigrants from Syria are Guamanian/Chamorro (11.7%, a difference of 0.11%), Immigrants from Western Asia (11.6%, a difference of 0.42%), Immigrants from Eritrea (11.7%, a difference of 0.48%), Osage (11.7%, a difference of 0.51%), and Peruvian (11.7%, a difference of 0.58%).
| Demographics | Rating | Rank | Receiving Food Stamps |
| Immigrants | Belarus | 62.8 /100 | #166 | Good 11.5% |
| Kenyans | 60.2 /100 | #167 | Good 11.6% |
| Tlingit-Haida | 59.1 /100 | #168 | Average 11.6% |
| Immigrants | Eastern Africa | 58.3 /100 | #169 | Average 11.6% |
| Costa Ricans | 57.9 /100 | #170 | Average 11.6% |
| Immigrants | Western Asia | 56.4 /100 | #171 | Average 11.6% |
| Guamanians/Chamorros | 54.2 /100 | #172 | Average 11.7% |
| Immigrants | Syria | 53.4 /100 | #173 | Average 11.7% |
| Immigrants | Eritrea | 50.0 /100 | #174 | Average 11.7% |
| Osage | 49.8 /100 | #175 | Average 11.7% |
| Peruvians | 49.3 /100 | #176 | Average 11.7% |
| Immigrants | Ukraine | 48.4 /100 | #177 | Average 11.8% |
| German Russians | 48.1 /100 | #178 | Average 11.8% |
| Immigrants | Kenya | 46.4 /100 | #179 | Average 11.8% |
| Uruguayans | 44.8 /100 | #180 | Average 11.8% |