Aleut vs Immigrants from Panama Family Poverty
COMPARE
Aleut
Immigrants from Panama
Family Poverty
Family Poverty Comparison
Aleuts
Immigrants from Panama
9.5%
FAMILY POVERTY
18.0/ 100
METRIC RATING
205th/ 347
METRIC RANK
10.0%
FAMILY POVERTY
3.1/ 100
METRIC RATING
230th/ 347
METRIC RANK
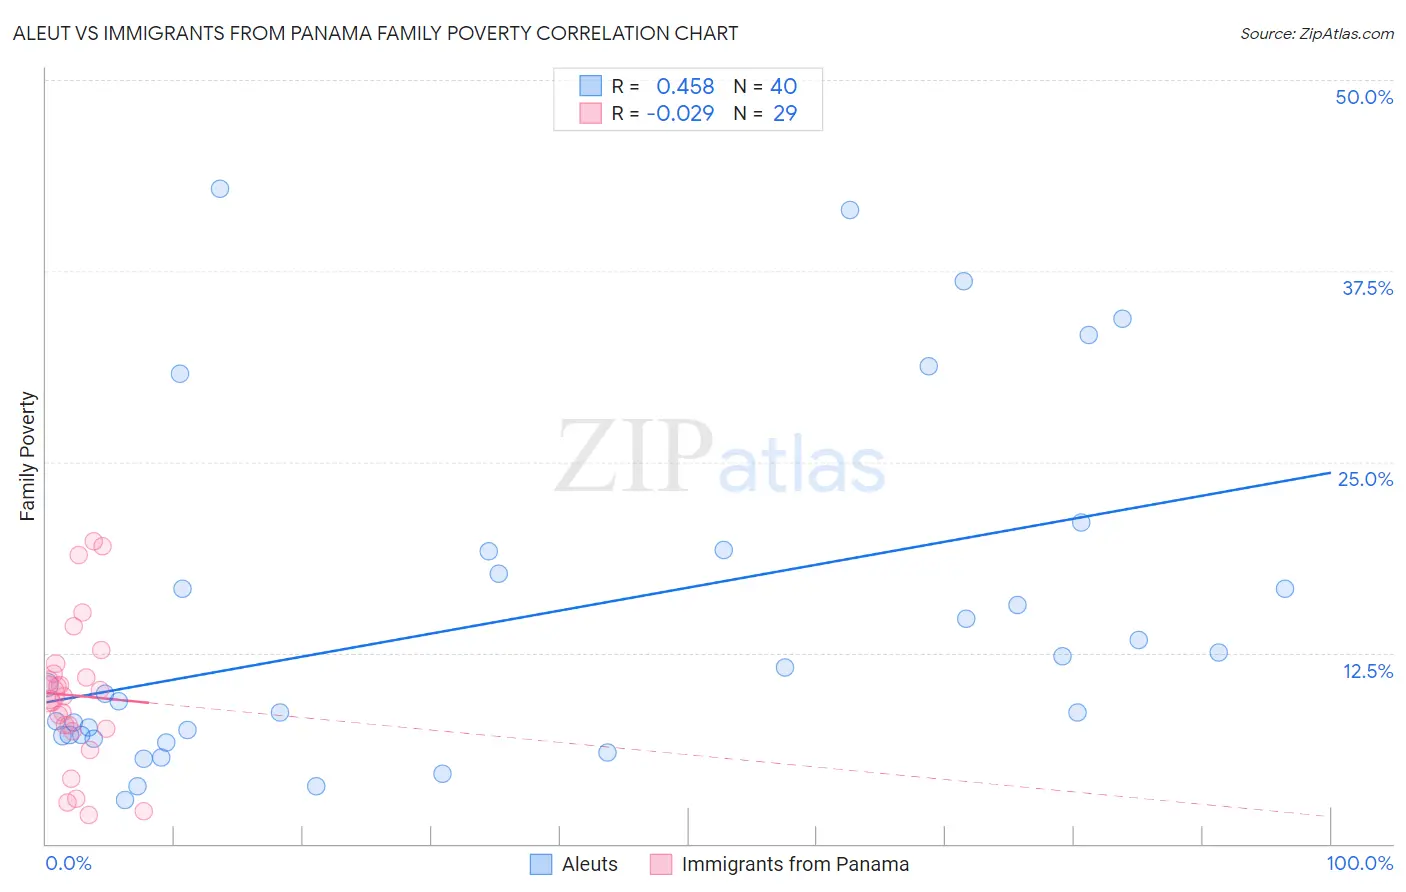
Aleut vs Immigrants from Panama Family Poverty Correlation Chart
The statistical analysis conducted on geographies consisting of 61,739,595 people shows a moderate positive correlation between the proportion of Aleuts and poverty level among families in the United States with a correlation coefficient (R) of 0.458 and weighted average of 9.5%. Similarly, the statistical analysis conducted on geographies consisting of 220,994,048 people shows no correlation between the proportion of Immigrants from Panama and poverty level among families in the United States with a correlation coefficient (R) of -0.029 and weighted average of 10.0%, a difference of 6.0%.
Family Poverty Correlation Summary
| Measurement | Aleut | Immigrants from Panama |
| Minimum | 2.9% | 1.9% |
| Maximum | 42.9% | 19.8% |
| Range | 40.0% | 17.9% |
| Mean | 14.6% | 9.7% |
| Median | 10.1% | 9.7% |
| Interquartile 25% (IQ1) | 7.1% | 7.4% |
| Interquartile 75% (IQ3) | 18.4% | 11.5% |
| Interquartile Range (IQR) | 11.3% | 4.0% |
| Standard Deviation (Sample) | 11.0% | 4.7% |
| Standard Deviation (Population) | 10.9% | 4.6% |
Similar Demographics by Family Poverty
Demographics Similar to Aleuts by Family Poverty
In terms of family poverty, the demographic groups most similar to Aleuts are Immigrants from South America (9.5%, a difference of 0.010%), Immigrants from Lebanon (9.4%, a difference of 0.19%), German Russian (9.4%, a difference of 0.29%), Immigrants from Sierra Leone (9.4%, a difference of 0.33%), and Immigrants from Portugal (9.4%, a difference of 0.51%).
| Demographics | Rating | Rank | Family Poverty |
| Iraqis | 24.2 /100 | #198 | Fair 9.3% |
| Spaniards | 22.8 /100 | #199 | Fair 9.4% |
| Immigrants | Costa Rica | 21.7 /100 | #200 | Fair 9.4% |
| Immigrants | Portugal | 20.5 /100 | #201 | Fair 9.4% |
| Immigrants | Sierra Leone | 19.6 /100 | #202 | Poor 9.4% |
| German Russians | 19.4 /100 | #203 | Poor 9.4% |
| Immigrants | Lebanon | 18.9 /100 | #204 | Poor 9.4% |
| Aleuts | 18.0 /100 | #205 | Poor 9.5% |
| Immigrants | South America | 18.0 /100 | #206 | Poor 9.5% |
| Sierra Leoneans | 15.6 /100 | #207 | Poor 9.5% |
| Immigrants | Eastern Africa | 15.1 /100 | #208 | Poor 9.5% |
| Immigrants | Uruguay | 14.0 /100 | #209 | Poor 9.5% |
| Alsatians | 11.3 /100 | #210 | Poor 9.6% |
| Malaysians | 10.6 /100 | #211 | Poor 9.6% |
| Immigrants | Thailand | 9.7 /100 | #212 | Tragic 9.7% |
Demographics Similar to Immigrants from Panama by Family Poverty
In terms of family poverty, the demographic groups most similar to Immigrants from Panama are Immigrants from Uzbekistan (10.0%, a difference of 0.020%), Sudanese (10.0%, a difference of 0.030%), Immigrants from Armenia (10.0%, a difference of 0.23%), Ottawa (10.0%, a difference of 0.25%), and Alaskan Athabascan (10.1%, a difference of 0.38%).
| Demographics | Rating | Rank | Family Poverty |
| Immigrants | Africa | 4.3 /100 | #223 | Tragic 9.9% |
| Marshallese | 3.9 /100 | #224 | Tragic 9.9% |
| Immigrants | Immigrants | 3.6 /100 | #225 | Tragic 10.0% |
| Ottawa | 3.3 /100 | #226 | Tragic 10.0% |
| Immigrants | Armenia | 3.3 /100 | #227 | Tragic 10.0% |
| Sudanese | 3.1 /100 | #228 | Tragic 10.0% |
| Immigrants | Uzbekistan | 3.1 /100 | #229 | Tragic 10.0% |
| Immigrants | Panama | 3.1 /100 | #230 | Tragic 10.0% |
| Alaskan Athabascans | 2.7 /100 | #231 | Tragic 10.1% |
| Immigrants | Sudan | 2.3 /100 | #232 | Tragic 10.1% |
| Fijians | 2.1 /100 | #233 | Tragic 10.1% |
| Immigrants | Middle Africa | 2.1 /100 | #234 | Tragic 10.1% |
| Nigerians | 2.0 /100 | #235 | Tragic 10.1% |
| Immigrants | Nigeria | 1.9 /100 | #236 | Tragic 10.2% |
| Immigrants | Laos | 1.7 /100 | #237 | Tragic 10.2% |