Aleut vs Belgian Family Poverty
COMPARE
Aleut
Belgian
Family Poverty
Family Poverty Comparison
Aleuts
Belgians
9.5%
FAMILY POVERTY
18.0/ 100
METRIC RATING
205th/ 347
METRIC RANK
8.0%
FAMILY POVERTY
97.3/ 100
METRIC RATING
87th/ 347
METRIC RANK
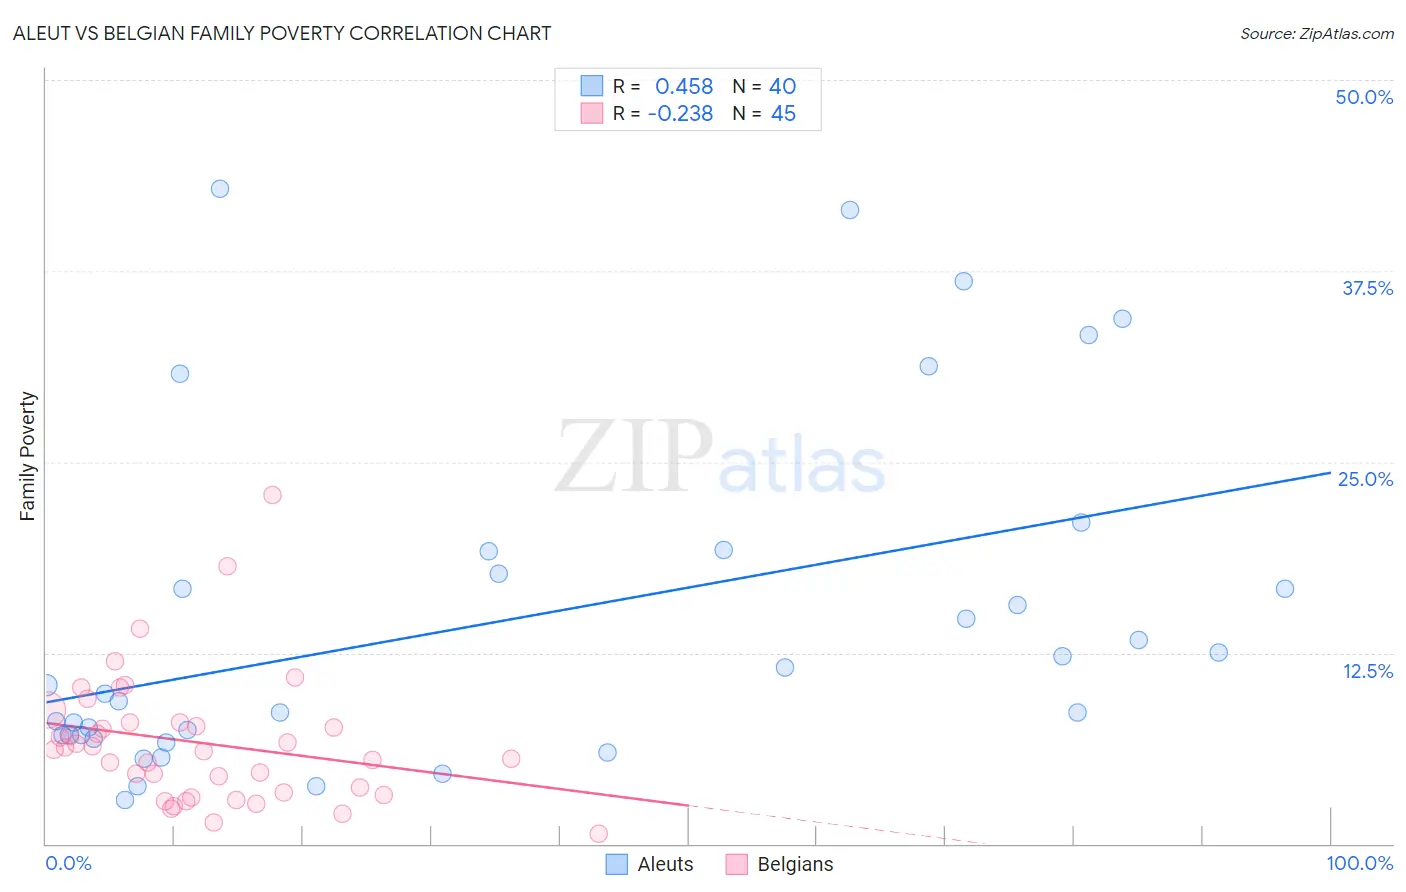
Aleut vs Belgian Family Poverty Correlation Chart
The statistical analysis conducted on geographies consisting of 61,739,595 people shows a moderate positive correlation between the proportion of Aleuts and poverty level among families in the United States with a correlation coefficient (R) of 0.458 and weighted average of 9.5%. Similarly, the statistical analysis conducted on geographies consisting of 355,051,863 people shows a weak negative correlation between the proportion of Belgians and poverty level among families in the United States with a correlation coefficient (R) of -0.238 and weighted average of 8.0%, a difference of 18.9%.
Family Poverty Correlation Summary
| Measurement | Aleut | Belgian |
| Minimum | 2.9% | 0.68% |
| Maximum | 42.9% | 22.9% |
| Range | 40.0% | 22.2% |
| Mean | 14.6% | 6.6% |
| Median | 10.1% | 6.2% |
| Interquartile 25% (IQ1) | 7.1% | 3.3% |
| Interquartile 75% (IQ3) | 18.4% | 8.0% |
| Interquartile Range (IQR) | 11.3% | 4.7% |
| Standard Deviation (Sample) | 11.0% | 4.3% |
| Standard Deviation (Population) | 10.9% | 4.2% |
Similar Demographics by Family Poverty
Demographics Similar to Aleuts by Family Poverty
In terms of family poverty, the demographic groups most similar to Aleuts are Immigrants from South America (9.5%, a difference of 0.010%), Immigrants from Lebanon (9.4%, a difference of 0.19%), German Russian (9.4%, a difference of 0.29%), Immigrants from Sierra Leone (9.4%, a difference of 0.33%), and Immigrants from Portugal (9.4%, a difference of 0.51%).
| Demographics | Rating | Rank | Family Poverty |
| Iraqis | 24.2 /100 | #198 | Fair 9.3% |
| Spaniards | 22.8 /100 | #199 | Fair 9.4% |
| Immigrants | Costa Rica | 21.7 /100 | #200 | Fair 9.4% |
| Immigrants | Portugal | 20.5 /100 | #201 | Fair 9.4% |
| Immigrants | Sierra Leone | 19.6 /100 | #202 | Poor 9.4% |
| German Russians | 19.4 /100 | #203 | Poor 9.4% |
| Immigrants | Lebanon | 18.9 /100 | #204 | Poor 9.4% |
| Aleuts | 18.0 /100 | #205 | Poor 9.5% |
| Immigrants | South America | 18.0 /100 | #206 | Poor 9.5% |
| Sierra Leoneans | 15.6 /100 | #207 | Poor 9.5% |
| Immigrants | Eastern Africa | 15.1 /100 | #208 | Poor 9.5% |
| Immigrants | Uruguay | 14.0 /100 | #209 | Poor 9.5% |
| Alsatians | 11.3 /100 | #210 | Poor 9.6% |
| Malaysians | 10.6 /100 | #211 | Poor 9.6% |
| Immigrants | Thailand | 9.7 /100 | #212 | Tragic 9.7% |
Demographics Similar to Belgians by Family Poverty
In terms of family poverty, the demographic groups most similar to Belgians are Serbian (8.0%, a difference of 0.070%), Scottish (7.9%, a difference of 0.090%), Immigrants from Asia (7.9%, a difference of 0.13%), Immigrants from Denmark (8.0%, a difference of 0.21%), and Immigrants from England (8.0%, a difference of 0.21%).
| Demographics | Rating | Rank | Family Poverty |
| English | 97.8 /100 | #80 | Exceptional 7.9% |
| Irish | 97.8 /100 | #81 | Exceptional 7.9% |
| Immigrants | Poland | 97.8 /100 | #82 | Exceptional 7.9% |
| Slovaks | 97.7 /100 | #83 | Exceptional 7.9% |
| British | 97.5 /100 | #84 | Exceptional 7.9% |
| Immigrants | Asia | 97.4 /100 | #85 | Exceptional 7.9% |
| Scottish | 97.3 /100 | #86 | Exceptional 7.9% |
| Belgians | 97.3 /100 | #87 | Exceptional 8.0% |
| Serbians | 97.2 /100 | #88 | Exceptional 8.0% |
| Immigrants | Denmark | 97.1 /100 | #89 | Exceptional 8.0% |
| Immigrants | England | 97.1 /100 | #90 | Exceptional 8.0% |
| Immigrants | Italy | 97.0 /100 | #91 | Exceptional 8.0% |
| Czechoslovakians | 96.8 /100 | #92 | Exceptional 8.0% |
| Tlingit-Haida | 96.7 /100 | #93 | Exceptional 8.0% |
| Immigrants | Pakistan | 96.6 /100 | #94 | Exceptional 8.0% |