Alaska Native vs Irish Male Poverty
COMPARE
Alaska Native
Irish
Male Poverty
Male Poverty Comparison
Alaska Natives
Irish
12.4%
MALE POVERTY
1.4/ 100
METRIC RATING
227th/ 347
METRIC RANK
10.3%
MALE POVERTY
96.8/ 100
METRIC RATING
78th/ 347
METRIC RANK
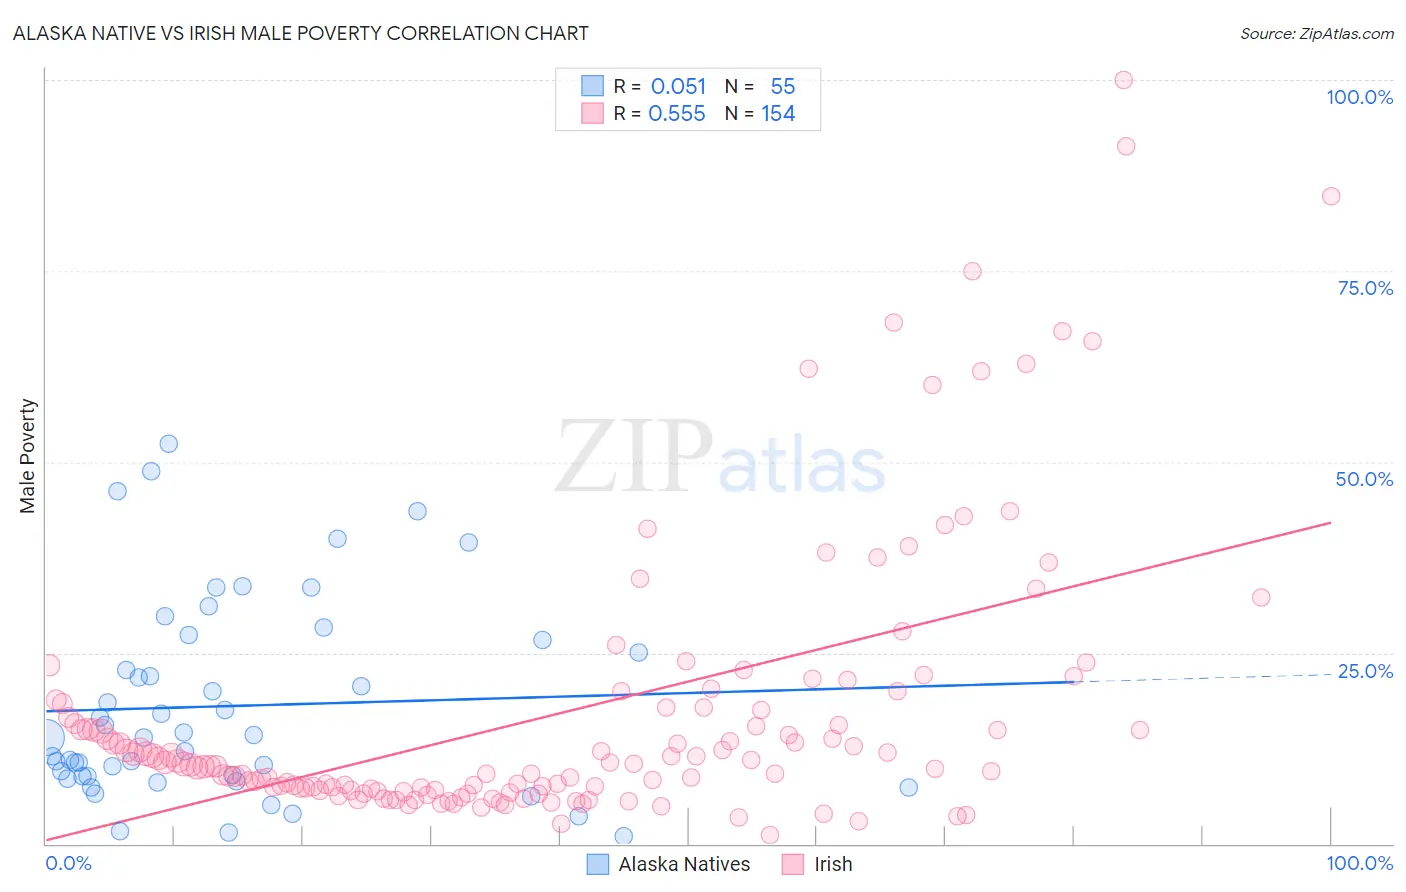
Alaska Native vs Irish Male Poverty Correlation Chart
The statistical analysis conducted on geographies consisting of 76,750,766 people shows a slight positive correlation between the proportion of Alaska Natives and poverty level among males in the United States with a correlation coefficient (R) of 0.051 and weighted average of 12.4%. Similarly, the statistical analysis conducted on geographies consisting of 578,330,947 people shows a substantial positive correlation between the proportion of Irish and poverty level among males in the United States with a correlation coefficient (R) of 0.555 and weighted average of 10.3%, a difference of 20.6%.
Male Poverty Correlation Summary
| Measurement | Alaska Native | Irish |
| Minimum | 0.96% | 1.2% |
| Maximum | 52.4% | 100.0% |
| Range | 51.4% | 98.8% |
| Mean | 18.0% | 17.0% |
| Median | 14.0% | 10.4% |
| Interquartile 25% (IQ1) | 8.8% | 7.0% |
| Interquartile 75% (IQ3) | 26.6% | 17.8% |
| Interquartile Range (IQR) | 17.8% | 10.8% |
| Standard Deviation (Sample) | 12.9% | 18.1% |
| Standard Deviation (Population) | 12.8% | 18.1% |
Similar Demographics by Male Poverty
Demographics Similar to Alaska Natives by Male Poverty
In terms of male poverty, the demographic groups most similar to Alaska Natives are Alsatian (12.4%, a difference of 0.040%), Nigerian (12.3%, a difference of 0.090%), Cuban (12.4%, a difference of 0.13%), Osage (12.3%, a difference of 0.26%), and Immigrants from Nigeria (12.3%, a difference of 0.32%).
| Demographics | Rating | Rank | Male Poverty |
| Immigrants | Eritrea | 2.4 /100 | #220 | Tragic 12.2% |
| Ugandans | 2.2 /100 | #221 | Tragic 12.2% |
| Immigrants | Africa | 2.1 /100 | #222 | Tragic 12.2% |
| Immigrants | Micronesia | 2.1 /100 | #223 | Tragic 12.2% |
| Immigrants | Nigeria | 1.6 /100 | #224 | Tragic 12.3% |
| Osage | 1.5 /100 | #225 | Tragic 12.3% |
| Nigerians | 1.4 /100 | #226 | Tragic 12.3% |
| Alaska Natives | 1.4 /100 | #227 | Tragic 12.4% |
| Alsatians | 1.3 /100 | #228 | Tragic 12.4% |
| Cubans | 1.3 /100 | #229 | Tragic 12.4% |
| Marshallese | 0.8 /100 | #230 | Tragic 12.5% |
| Salvadorans | 0.6 /100 | #231 | Tragic 12.6% |
| Nicaraguans | 0.6 /100 | #232 | Tragic 12.6% |
| Fijians | 0.6 /100 | #233 | Tragic 12.6% |
| Immigrants | Armenia | 0.6 /100 | #234 | Tragic 12.6% |
Demographics Similar to Irish by Male Poverty
In terms of male poverty, the demographic groups most similar to Irish are Immigrants from Belgium (10.3%, a difference of 0.020%), Dutch (10.2%, a difference of 0.050%), Carpatho Rusyn (10.2%, a difference of 0.060%), Immigrants from Eastern Europe (10.2%, a difference of 0.070%), and Immigrants from Asia (10.2%, a difference of 0.14%).
| Demographics | Rating | Rank | Male Poverty |
| Europeans | 97.1 /100 | #71 | Exceptional 10.2% |
| Immigrants | Canada | 97.1 /100 | #72 | Exceptional 10.2% |
| Immigrants | Asia | 97.0 /100 | #73 | Exceptional 10.2% |
| Immigrants | Eastern Europe | 96.9 /100 | #74 | Exceptional 10.2% |
| Carpatho Rusyns | 96.9 /100 | #75 | Exceptional 10.2% |
| Dutch | 96.9 /100 | #76 | Exceptional 10.2% |
| Immigrants | Belgium | 96.8 /100 | #77 | Exceptional 10.3% |
| Irish | 96.8 /100 | #78 | Exceptional 10.3% |
| Immigrants | North America | 96.5 /100 | #79 | Exceptional 10.3% |
| English | 96.4 /100 | #80 | Exceptional 10.3% |
| Belgians | 95.9 /100 | #81 | Exceptional 10.3% |
| Egyptians | 95.9 /100 | #82 | Exceptional 10.3% |
| Immigrants | Sweden | 95.7 /100 | #83 | Exceptional 10.3% |
| Czechoslovakians | 95.6 /100 | #84 | Exceptional 10.3% |
| Immigrants | England | 95.5 /100 | #85 | Exceptional 10.4% |