Alaska Native vs Immigrants from Argentina Male Poverty

COMPARE

Alaska Native
Race
Ancestry
AfghanAfricanAlaska NativeAlaskan AthabascanAlbanianAleutAlsatianAmericanApacheArabArapahoArgentineanArmenianAssyrian/Chaldean/SyriacAustralianAustrianBahamianBangladeshiBarbadianBasqueBelgianBelizeanBermudanBhutaneseBlackfeetBolivianBrazilianBritishBritish West IndianBulgarianBurmeseCajunCambodianCanadianCape VerdeanCarpatho RusynCelticCentral AmericanCentral American IndianCherokeeCheyenneChickasawChileanChineseChippewaChoctawColombianColvilleComancheCosta RicanCreeCreekCroatianCrowCubanCypriotCzechCzechoslovakianDanishDelawareDominicanDutchDutch West IndianEastern EuropeanEcuadorianEgyptianEnglishEstonianEthiopianEuropeanFijianFilipinoFinnishFrenchFrench American IndianFrench CanadianGermanGerman RussianGhanaianGreekGuamanian/ChamorroGuatemalanGuyaneseHaitianHmongHonduranHopiHoumaHungarianIcelanderIndian (Asian)IndonesianInupiatIranianIraqiIrishIroquoisIsraeliItalianJamaicanJapaneseJordanianKenyanKiowaKoreanLaotianLatvianLebaneseLiberianLithuanianLumbeeLuxembourgerMacedonianMalaysianMalteseMarshalleseMenomineeMexicanMexican American IndianMongolianMoroccanNative HawaiianNavajoNepaleseNew ZealanderNicaraguanNigerianNorthern EuropeanNorwegianOkinawanOsageOttawaPaiutePakistaniPalestinianPanamanianParaguayanPennsylvania GermanPeruvianPimaPolishPortuguesePotawatomiPuebloPuerto RicanPuget Sound SalishRomanianRussianSalvadoranSamoanScandinavianScotch-IrishScottishSeminoleSenegaleseSerbianShoshoneSierra LeoneanSiouxSlavicSlovakSloveneSomaliSouth AfricanSouth AmericanSouth American IndianSoviet UnionSpaniardSpanishSpanish AmericanSpanish American IndianSri LankanSubsaharan AfricanSudaneseSwedishSwissSyrianTaiwaneseThaiTlingit-HaidaTohono O'OdhamTonganTrinidadian and TobagonianTsimshianTurkishU.S. Virgin IslanderUgandanUkrainianUruguayanUteVenezuelanVietnameseWelshWest IndianYakamaYaquiYugoslavianYumanYup'ikZimbabwean
Immigration
NonimmigrantsImmigrantsAfghanistanAfricaAlbaniaArmeniaAsiaAustraliaAustriaBahamasBangladeshBarbadosBelarusBelgiumBelizeBoliviaBosnia and HerzegovinaBrazilBulgariaBurma/MyanmarCabo VerdeCambodiaCameroonCanadaCaribbeanCentral AmericaChileChinaColombiaCongoCosta RicaCroatiaCubaCzechoslovakiaDenmarkDominicaDominican RepublicEastern AfricaEastern AsiaEastern EuropeEcuadorEgyptEl SalvadorEnglandEritreaEthiopiaEuropeFijiFranceGermanyGhanaGreeceGrenadaGuatemalaGuyanaHaitiHondurasHong KongHungaryIndiaIndonesiaIranIraqIrelandIsraelItalyJamaicaJapanJordanKazakhstanKenyaKoreaKuwaitLaosLatin AmericaLatviaLebanonLiberiaLithuaniaMalaysiaMexicoMicronesiaMiddle AfricaMoldovaMoroccoNepalNetherlandsNicaraguaNigeriaNorth AmericaNorth MacedoniaNorthern AfricaNorthern EuropeNorwayOceaniaPakistanPanamaPeruPhilippinesPolandPortugalRomaniaRussiaSaudi ArabiaScotlandSenegalSerbiaSierra LeoneSingaporeSomaliaSouth AfricaSouth AmericaSouth Central AsiaSouth Eastern AsiaSouthern EuropeSpainSri LankaSt. Vincent and the GrenadinesSudanSwedenSwitzerlandSyriaTaiwanThailandTrinidad and TobagoTurkeyUgandaUkraineUruguayUzbekistanVenezuelaVietnamWest IndiesWestern AfricaWestern AsiaWestern EuropeYemenZaireZimbabweAzores
Immigrants from Argentina
Race
Ancestry
AfghanAfricanAlaskan AthabascanAlbanianAleutAlsatianAmericanApacheArabArapahoArgentineanArmenianAssyrian/Chaldean/SyriacAustralianAustrianBahamianBangladeshiBarbadianBasqueBelgianBelizeanBermudanBhutaneseBlackfeetBolivianBrazilianBritishBritish West IndianBulgarianBurmeseCajunCambodianCanadianCape VerdeanCarpatho RusynCelticCentral AmericanCentral American IndianCherokeeCheyenneChickasawChileanChineseChippewaChoctawColombianColvilleComancheCosta RicanCreeCreekCroatianCrowCubanCypriotCzechCzechoslovakianDanishDelawareDominicanDutchDutch West IndianEastern EuropeanEcuadorianEgyptianEnglishEstonianEthiopianEuropeanFijianFilipinoFinnishFrenchFrench American IndianFrench CanadianGermanGerman RussianGhanaianGreekGuamanian/ChamorroGuatemalanGuyaneseHaitianHmongHonduranHopiHoumaHungarianIcelanderIndian (Asian)IndonesianInupiatIranianIraqiIrishIroquoisIsraeliItalianJamaicanJapaneseJordanianKenyanKiowaKoreanLaotianLatvianLebaneseLiberianLithuanianLumbeeLuxembourgerMacedonianMalaysianMalteseMarshalleseMenomineeMexicanMexican American IndianMongolianMoroccanNative HawaiianNavajoNepaleseNew ZealanderNicaraguanNigerianNorthern EuropeanNorwegianOkinawanOsageOttawaPaiutePakistaniPalestinianPanamanianParaguayanPennsylvania GermanPeruvianPimaPolishPortuguesePotawatomiPuebloPuerto RicanPuget Sound SalishRomanianRussianSalvadoranSamoanScandinavianScotch-IrishScottishSeminoleSenegaleseSerbianShoshoneSierra LeoneanSiouxSlavicSlovakSloveneSomaliSouth AfricanSouth AmericanSouth American IndianSoviet UnionSpaniardSpanishSpanish AmericanSpanish American IndianSri LankanSubsaharan AfricanSudaneseSwedishSwissSyrianTaiwaneseThaiTlingit-HaidaTohono O'OdhamTonganTrinidadian and TobagonianTsimshianTurkishU.S. Virgin IslanderUgandanUkrainianUruguayanUteVenezuelanVietnameseWelshWest IndianYakamaYaquiYugoslavianYumanYup'ikZimbabwean
Immigration
NonimmigrantsImmigrantsAfghanistanAfricaAlbaniaArgentinaArmeniaAsiaAustraliaAustriaBahamasBangladeshBarbadosBelarusBelgiumBelizeBoliviaBosnia and HerzegovinaBrazilBulgariaBurma/MyanmarCabo VerdeCambodiaCameroonCanadaCaribbeanCentral AmericaChileChinaColombiaCongoCosta RicaCroatiaCubaCzechoslovakiaDenmarkDominicaDominican RepublicEastern AfricaEastern AsiaEastern EuropeEcuadorEgyptEl SalvadorEnglandEritreaEthiopiaEuropeFijiFranceGermanyGhanaGreeceGrenadaGuatemalaGuyanaHaitiHondurasHong KongHungaryIndiaIndonesiaIranIraqIrelandIsraelItalyJamaicaJapanJordanKazakhstanKenyaKoreaKuwaitLaosLatin AmericaLatviaLebanonLiberiaLithuaniaMalaysiaMexicoMicronesiaMiddle AfricaMoldovaMoroccoNepalNetherlandsNicaraguaNigeriaNorth AmericaNorth MacedoniaNorthern AfricaNorthern EuropeNorwayOceaniaPakistanPanamaPeruPhilippinesPolandPortugalRomaniaRussiaSaudi ArabiaScotlandSenegalSerbiaSierra LeoneSingaporeSomaliaSouth AfricaSouth AmericaSouth Central AsiaSouth Eastern AsiaSouthern EuropeSpainSri LankaSt. Vincent and the GrenadinesSudanSwedenSwitzerlandSyriaTaiwanThailandTrinidad and TobagoTurkeyUgandaUkraineUruguayUzbekistanVenezuelaVietnamWest IndiesWestern AfricaWestern AsiaWestern EuropeYemenZaireZimbabweAzores
Male Poverty
Income
Poverty
Unemployment
Labor Participation
Family Structure
Vehicle Availability
Education Level
Disability

Male Poverty Comparison

Alaska Natives

Immigrants from Argentina

Tragic
Excellent
12.4%
MALE POVERTY
1.4/ 100
METRIC RATING
227th/ 347
METRIC RANK
10.6%
MALE POVERTY
89.8/ 100
METRIC RATING
111th/ 347
METRIC RANK

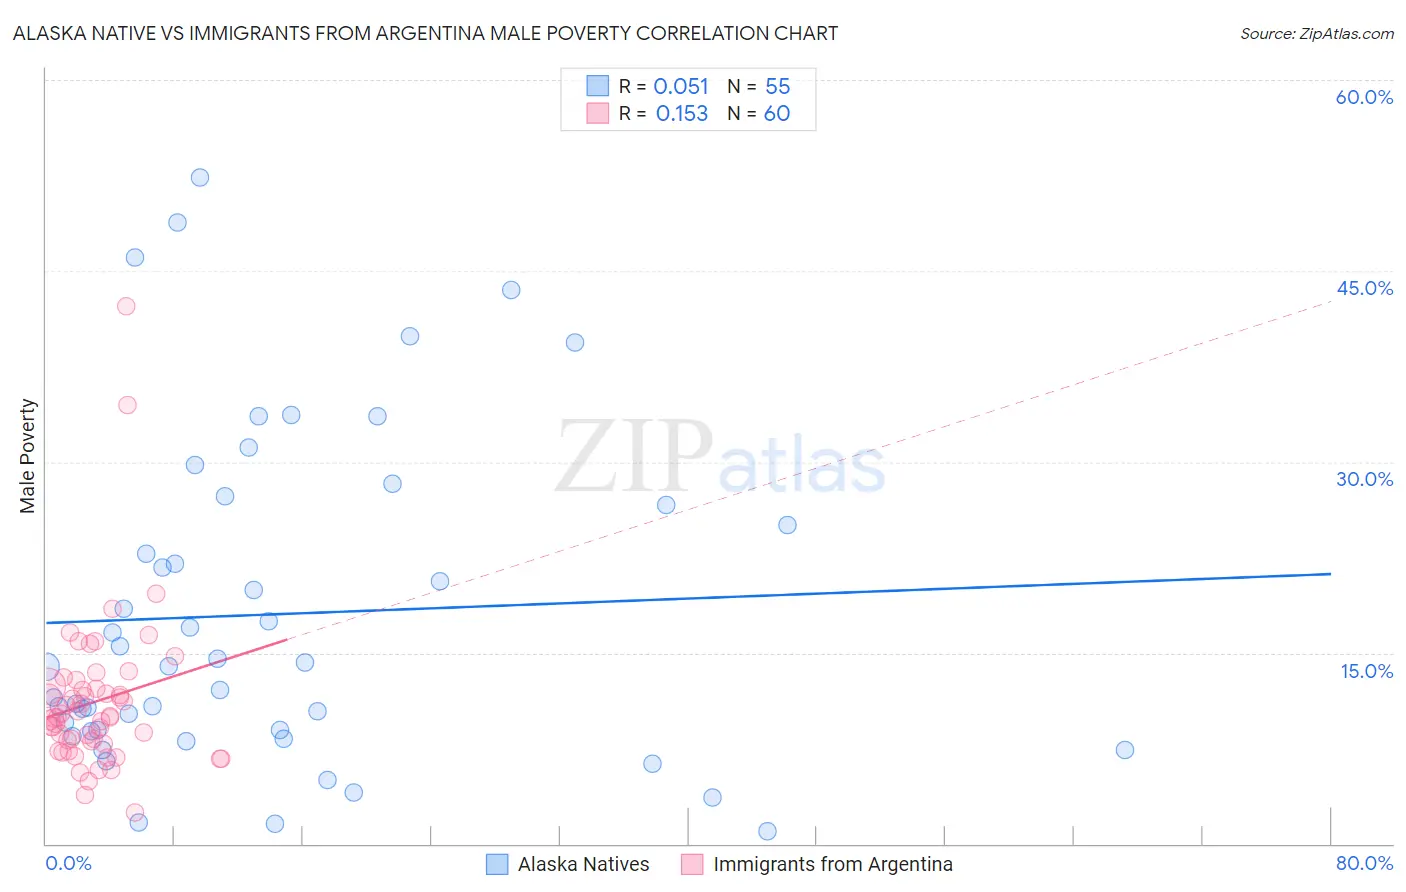
Alaska Native vs Immigrants from Argentina Male Poverty Correlation Chart

The statistical analysis conducted on geographies consisting of 76,750,766 people shows a slight positive correlation between the proportion of Alaska Natives and poverty level among males in the United States with a correlation coefficient (R) of 0.051 and weighted average of 12.4%. Similarly, the statistical analysis conducted on geographies consisting of 264,308,619 people shows a poor positive correlation between the proportion of Immigrants from Argentina and poverty level among males in the United States with a correlation coefficient (R) of 0.153 and weighted average of 10.6%, a difference of 16.7%.
Alaska Native vs Immigrants from Argentina Male Poverty

Male Poverty Correlation Summary

MeasurementAlaska NativeImmigrants from Argentina
Minimum0.96%2.5%
Maximum52.4%42.3%
Range51.4%39.8%
Mean18.0%11.2%
Median14.0%9.9%
Interquartile 25% (IQ1)8.8%7.9%
Interquartile 75% (IQ3)26.6%12.3%
Interquartile Range (IQR)17.8%4.4%
Standard Deviation (Sample)12.9%6.2%
Standard Deviation (Population)12.8%6.2%

Similar Demographics by Male Poverty

Demographics Similar to Alaska Natives by Male Poverty

In terms of male poverty, the demographic groups most similar to Alaska Natives are Alsatian (12.4%, a difference of 0.040%), Nigerian (12.3%, a difference of 0.090%), Cuban (12.4%, a difference of 0.13%), Osage (12.3%, a difference of 0.26%), and Immigrants from Nigeria (12.3%, a difference of 0.32%).
DemographicsRating | RankMale Poverty
Immigrants | Eritrea
2.4
/100
|
#220
Tragic
12.2%
Ugandans
2.2
/100
|
#221
Tragic
12.2%
Immigrants | Africa
2.1
/100
|
#222
Tragic
12.2%
Immigrants | Micronesia
2.1
/100
|
#223
Tragic
12.2%
Immigrants | Nigeria
1.6
/100
|
#224
Tragic
12.3%
Osage
1.5
/100
|
#225
Tragic
12.3%
Nigerians
1.4
/100
|
#226
Tragic
12.3%
Alaska Natives
1.4
/100
|
#227
Tragic
12.4%
Alsatians
1.3
/100
|
#228
Tragic
12.4%
Cubans
1.3
/100
|
#229
Tragic
12.4%
Marshallese
0.8
/100
|
#230
Tragic
12.5%
Salvadorans
0.6
/100
|
#231
Tragic
12.6%
Nicaraguans
0.6
/100
|
#232
Tragic
12.6%
Fijians
0.6
/100
|
#233
Tragic
12.6%
Immigrants | Armenia
0.6
/100
|
#234
Tragic
12.6%

Demographics Similar to Immigrants from Argentina by Male Poverty

In terms of male poverty, the demographic groups most similar to Immigrants from Argentina are Immigrants from Turkey (10.6%, a difference of 0.080%), Argentinean (10.6%, a difference of 0.11%), Palestinian (10.6%, a difference of 0.18%), Immigrants from Brazil (10.6%, a difference of 0.20%), and Albanian (10.6%, a difference of 0.24%).
DemographicsRating | RankMale Poverty
Welsh
91.6
/100
|
#104
Exceptional
10.5%
Canadians
91.6
/100
|
#105
Exceptional
10.5%
Immigrants | Southern Europe
91.3
/100
|
#106
Exceptional
10.5%
Laotians
91.2
/100
|
#107
Exceptional
10.5%
Portuguese
91.0
/100
|
#108
Exceptional
10.6%
Albanians
90.6
/100
|
#109
Exceptional
10.6%
Argentineans
90.1
/100
|
#110
Exceptional
10.6%
Immigrants | Argentina
89.8
/100
|
#111
Excellent
10.6%
Immigrants | Turkey
89.5
/100
|
#112
Excellent
10.6%
Palestinians
89.1
/100
|
#113
Excellent
10.6%
Immigrants | Brazil
89.0
/100
|
#114
Excellent
10.6%
Immigrants | Russia
88.6
/100
|
#115
Excellent
10.6%
Sri Lankans
88.1
/100
|
#116
Excellent
10.6%
Immigrants | South Eastern Asia
88.1
/100
|
#117
Excellent
10.6%
Okinawans
87.6
/100
|
#118
Excellent
10.7%