Afghan vs Tlingit-Haida Receiving Food Stamps
COMPARE
Afghan
Tlingit-Haida
Receiving Food Stamps
Receiving Food Stamps Comparison
Afghans
Tlingit-Haida
10.7%
RECEIVING FOOD STAMPS
92.6/ 100
METRIC RATING
126th/ 347
METRIC RANK
11.6%
RECEIVING FOOD STAMPS
59.1/ 100
METRIC RATING
168th/ 347
METRIC RANK
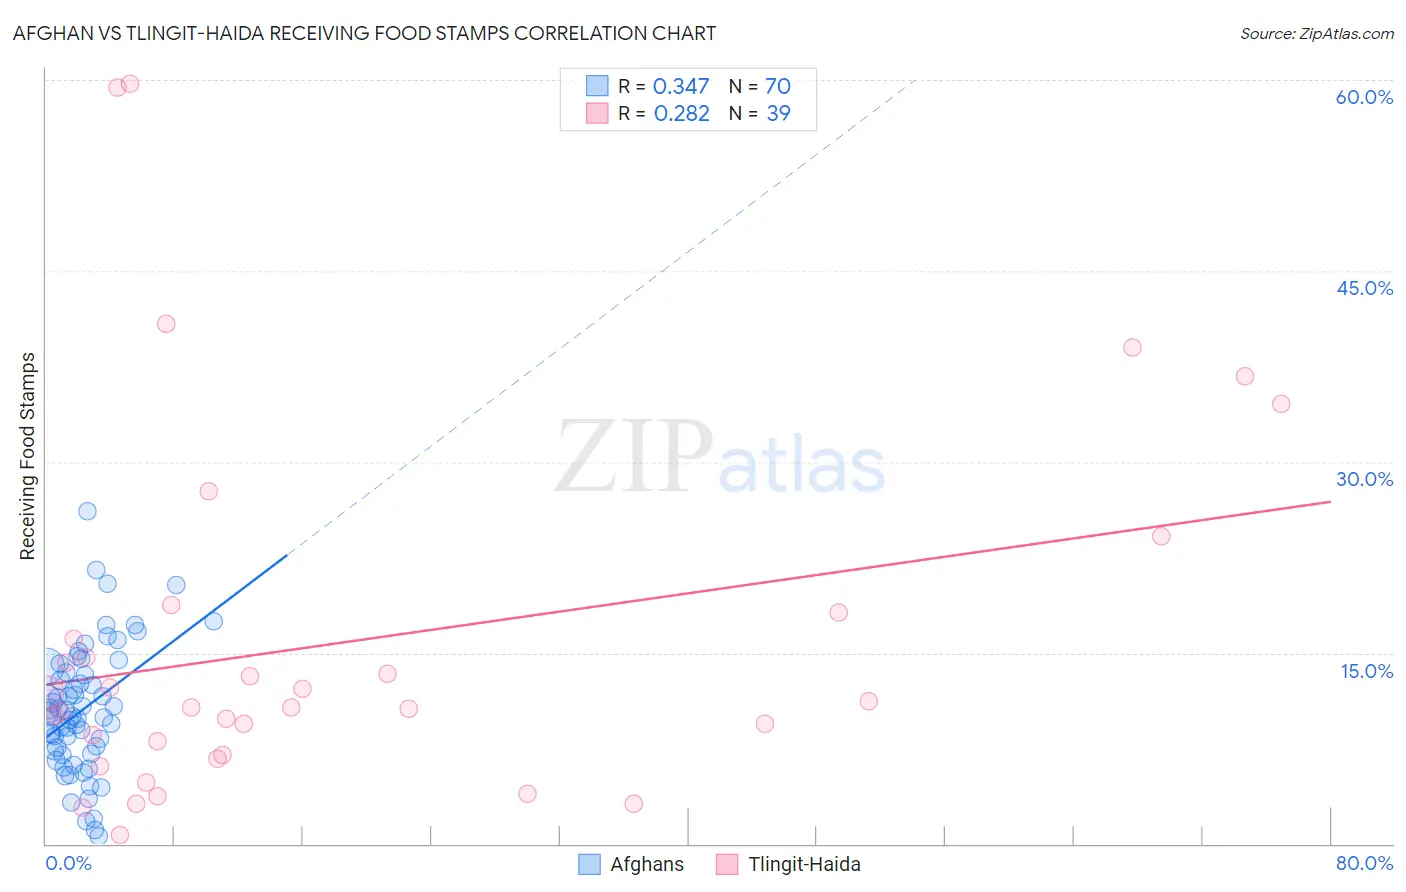
Afghan vs Tlingit-Haida Receiving Food Stamps Correlation Chart
The statistical analysis conducted on geographies consisting of 148,722,422 people shows a mild positive correlation between the proportion of Afghans and percentage of population receiving government assistance and/or food stamps in the United States with a correlation coefficient (R) of 0.347 and weighted average of 10.7%. Similarly, the statistical analysis conducted on geographies consisting of 60,831,023 people shows a weak positive correlation between the proportion of Tlingit-Haida and percentage of population receiving government assistance and/or food stamps in the United States with a correlation coefficient (R) of 0.282 and weighted average of 11.6%, a difference of 8.3%.
Receiving Food Stamps Correlation Summary
| Measurement | Afghan | Tlingit-Haida |
| Minimum | 0.60% | 0.70% |
| Maximum | 26.1% | 59.7% |
| Range | 25.5% | 59.0% |
| Mean | 10.5% | 15.8% |
| Median | 10.2% | 10.7% |
| Interquartile 25% (IQ1) | 7.3% | 7.0% |
| Interquartile 75% (IQ3) | 13.4% | 18.2% |
| Interquartile Range (IQR) | 6.1% | 11.2% |
| Standard Deviation (Sample) | 5.0% | 14.4% |
| Standard Deviation (Population) | 4.9% | 14.2% |
Similar Demographics by Receiving Food Stamps
Demographics Similar to Afghans by Receiving Food Stamps
In terms of receiving food stamps, the demographic groups most similar to Afghans are Immigrants from Ethiopia (10.7%, a difference of 0.020%), Immigrants from Jordan (10.7%, a difference of 0.030%), Yugoslavian (10.7%, a difference of 0.030%), Israeli (10.7%, a difference of 0.13%), and Ukrainian (10.7%, a difference of 0.14%).
| Demographics | Rating | Rank | Receiving Food Stamps |
| Immigrants | Poland | 93.9 /100 | #119 | Exceptional 10.6% |
| Ethiopians | 93.9 /100 | #120 | Exceptional 10.6% |
| Slavs | 93.8 /100 | #121 | Exceptional 10.6% |
| Sri Lankans | 93.7 /100 | #122 | Exceptional 10.6% |
| Immigrants | Philippines | 93.3 /100 | #123 | Exceptional 10.7% |
| Paraguayans | 93.0 /100 | #124 | Exceptional 10.7% |
| Ukrainians | 92.8 /100 | #125 | Exceptional 10.7% |
| Afghans | 92.6 /100 | #126 | Exceptional 10.7% |
| Immigrants | Ethiopia | 92.6 /100 | #127 | Exceptional 10.7% |
| Immigrants | Jordan | 92.5 /100 | #128 | Exceptional 10.7% |
| Yugoslavians | 92.5 /100 | #129 | Exceptional 10.7% |
| Israelis | 92.4 /100 | #130 | Exceptional 10.7% |
| French | 92.3 /100 | #131 | Exceptional 10.7% |
| Immigrants | Germany | 92.0 /100 | #132 | Exceptional 10.7% |
| Immigrants | Russia | 90.9 /100 | #133 | Exceptional 10.8% |
Demographics Similar to Tlingit-Haida by Receiving Food Stamps
In terms of receiving food stamps, the demographic groups most similar to Tlingit-Haida are Immigrants from Eastern Africa (11.6%, a difference of 0.12%), Kenyan (11.6%, a difference of 0.16%), Costa Rican (11.6%, a difference of 0.18%), Immigrants from Western Asia (11.6%, a difference of 0.40%), and Immigrants from Belarus (11.5%, a difference of 0.54%).
| Demographics | Rating | Rank | Receiving Food Stamps |
| Pennsylvania Germans | 68.4 /100 | #161 | Good 11.4% |
| Alsatians | 68.0 /100 | #162 | Good 11.4% |
| Immigrants | Southern Europe | 65.8 /100 | #163 | Good 11.5% |
| Immigrants | Chile | 65.0 /100 | #164 | Good 11.5% |
| Arabs | 64.7 /100 | #165 | Good 11.5% |
| Immigrants | Belarus | 62.8 /100 | #166 | Good 11.5% |
| Kenyans | 60.2 /100 | #167 | Good 11.6% |
| Tlingit-Haida | 59.1 /100 | #168 | Average 11.6% |
| Immigrants | Eastern Africa | 58.3 /100 | #169 | Average 11.6% |
| Costa Ricans | 57.9 /100 | #170 | Average 11.6% |
| Immigrants | Western Asia | 56.4 /100 | #171 | Average 11.6% |
| Guamanians/Chamorros | 54.2 /100 | #172 | Average 11.7% |
| Immigrants | Syria | 53.4 /100 | #173 | Average 11.7% |
| Immigrants | Eritrea | 50.0 /100 | #174 | Average 11.7% |
| Osage | 49.8 /100 | #175 | Average 11.7% |