Afghan vs Immigrants from Europe Seniors Poverty Over the Age of 75
COMPARE
Afghan
Immigrants from Europe
Seniors Poverty Over the Age of 75
Seniors Poverty Over the Age of 75 Comparison
Afghans
Immigrants from Europe
11.2%
SENIORS POVERTY OVER THE AGE OF 75
98.2/ 100
METRIC RATING
54th/ 347
METRIC RANK
12.2%
SENIORS POVERTY OVER THE AGE OF 75
50.0/ 100
METRIC RATING
174th/ 347
METRIC RANK
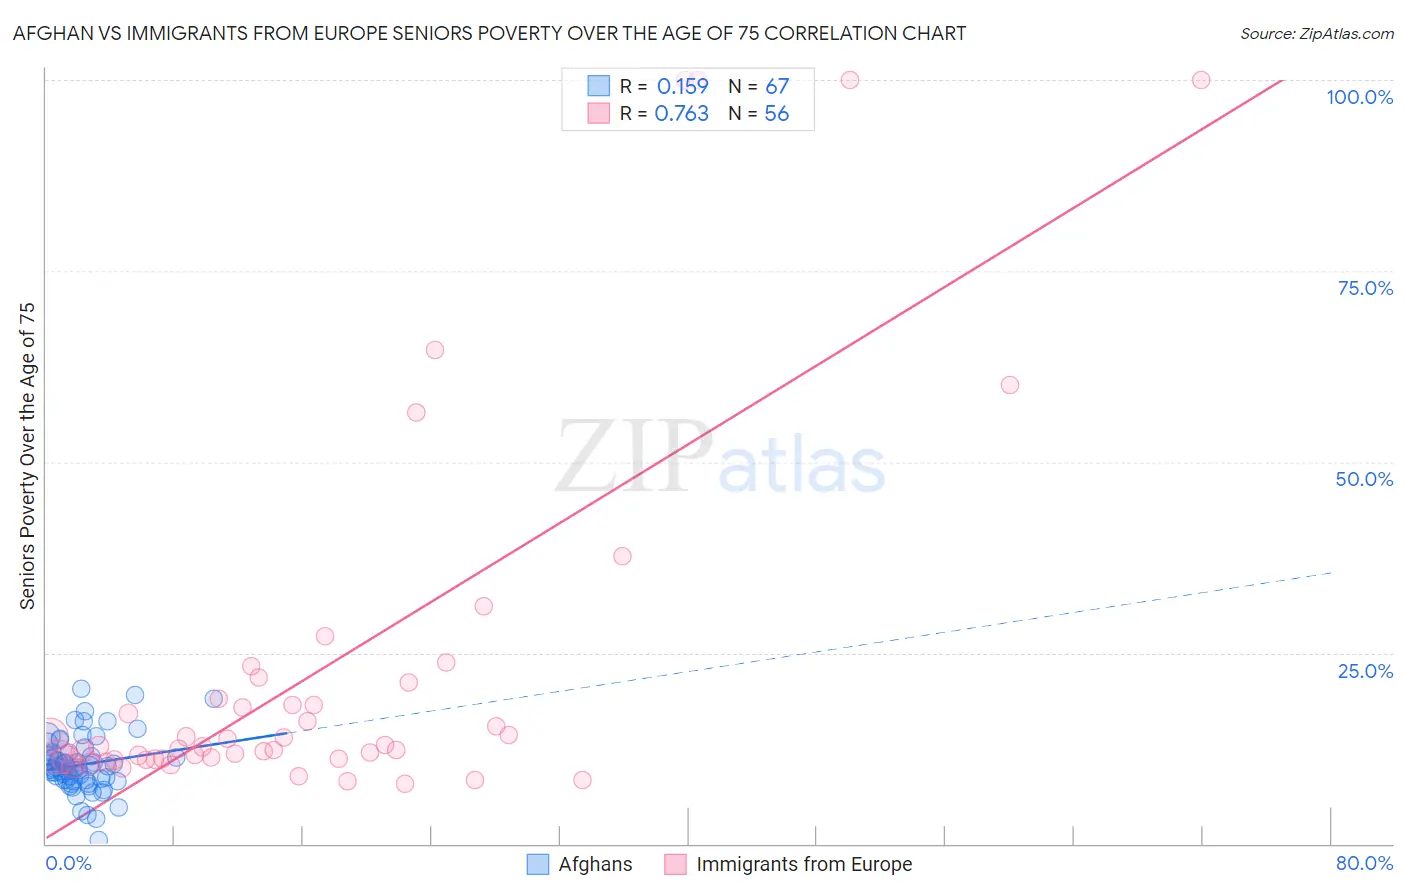
Afghan vs Immigrants from Europe Seniors Poverty Over the Age of 75 Correlation Chart
The statistical analysis conducted on geographies consisting of 148,083,803 people shows a poor positive correlation between the proportion of Afghans and poverty level among seniors over the age of 75 in the United States with a correlation coefficient (R) of 0.159 and weighted average of 11.2%. Similarly, the statistical analysis conducted on geographies consisting of 534,137,769 people shows a strong positive correlation between the proportion of Immigrants from Europe and poverty level among seniors over the age of 75 in the United States with a correlation coefficient (R) of 0.763 and weighted average of 12.2%, a difference of 8.8%.
Seniors Poverty Over the Age of 75 Correlation Summary
| Measurement | Afghan | Immigrants from Europe |
| Minimum | 0.56% | 7.9% |
| Maximum | 20.3% | 100.0% |
| Range | 19.7% | 92.1% |
| Mean | 10.4% | 23.0% |
| Median | 10.0% | 12.7% |
| Interquartile 25% (IQ1) | 8.3% | 11.1% |
| Interquartile 75% (IQ3) | 11.9% | 20.0% |
| Interquartile Range (IQR) | 3.7% | 8.9% |
| Standard Deviation (Sample) | 3.7% | 24.6% |
| Standard Deviation (Population) | 3.7% | 24.4% |
Similar Demographics by Seniors Poverty Over the Age of 75
Demographics Similar to Afghans by Seniors Poverty Over the Age of 75
In terms of seniors poverty over the age of 75, the demographic groups most similar to Afghans are Hungarian (11.2%, a difference of 0.070%), Slavic (11.2%, a difference of 0.090%), Immigrants from England (11.2%, a difference of 0.32%), Immigrants from Canada (11.2%, a difference of 0.32%), and Yugoslavian (11.2%, a difference of 0.35%).
| Demographics | Rating | Rank | Seniors Poverty Over the Age of 75 |
| Hawaiians | 98.8 /100 | #47 | Exceptional 11.1% |
| French | 98.7 /100 | #48 | Exceptional 11.1% |
| Samoans | 98.7 /100 | #49 | Exceptional 11.1% |
| Serbians | 98.6 /100 | #50 | Exceptional 11.1% |
| Immigrants | North Macedonia | 98.6 /100 | #51 | Exceptional 11.1% |
| Zimbabweans | 98.5 /100 | #52 | Exceptional 11.2% |
| Immigrants | England | 98.4 /100 | #53 | Exceptional 11.2% |
| Afghans | 98.2 /100 | #54 | Exceptional 11.2% |
| Hungarians | 98.1 /100 | #55 | Exceptional 11.2% |
| Slavs | 98.1 /100 | #56 | Exceptional 11.2% |
| Immigrants | Canada | 97.9 /100 | #57 | Exceptional 11.2% |
| Yugoslavians | 97.9 /100 | #58 | Exceptional 11.2% |
| Immigrants | Netherlands | 97.8 /100 | #59 | Exceptional 11.2% |
| Eastern Europeans | 97.7 /100 | #60 | Exceptional 11.3% |
| Canadians | 97.7 /100 | #61 | Exceptional 11.3% |
Demographics Similar to Immigrants from Europe by Seniors Poverty Over the Age of 75
In terms of seniors poverty over the age of 75, the demographic groups most similar to Immigrants from Europe are Arab (12.2%, a difference of 0.040%), Immigrants from Saudi Arabia (12.2%, a difference of 0.040%), Immigrants from Fiji (12.2%, a difference of 0.12%), Spaniard (12.2%, a difference of 0.13%), and Immigrants from Thailand (12.2%, a difference of 0.16%).
| Demographics | Rating | Rank | Seniors Poverty Over the Age of 75 |
| Immigrants | Switzerland | 54.5 /100 | #167 | Average 12.1% |
| Immigrants | Syria | 53.9 /100 | #168 | Average 12.2% |
| Immigrants | Egypt | 53.7 /100 | #169 | Average 12.2% |
| Immigrants | Thailand | 52.0 /100 | #170 | Average 12.2% |
| Spaniards | 51.6 /100 | #171 | Average 12.2% |
| Immigrants | Fiji | 51.5 /100 | #172 | Average 12.2% |
| Arabs | 50.5 /100 | #173 | Average 12.2% |
| Immigrants | Europe | 50.0 /100 | #174 | Average 12.2% |
| Immigrants | Saudi Arabia | 49.5 /100 | #175 | Average 12.2% |
| Immigrants | Iran | 48.1 /100 | #176 | Average 12.2% |
| Immigrants | Asia | 47.8 /100 | #177 | Average 12.2% |
| Immigrants | Nonimmigrants | 46.8 /100 | #178 | Average 12.2% |
| Mongolians | 45.5 /100 | #179 | Average 12.2% |
| Immigrants | South Eastern Asia | 44.3 /100 | #180 | Average 12.2% |
| Immigrants | Australia | 44.2 /100 | #181 | Average 12.2% |